Sprint velocity calculator
Enter the points finished in recent sprints and see the average velocity and how many sprints the backlog will take.
Free, runs in your browser, no sign-up. Updated 2026-10-25.
Result
Average velocity 21.7 points a sprint (range 18 to 25). 180 points take about 9 sprints (18 weeks); 8 to 10 sprints at the fastest and slowest pace so far.
- Average velocity
- 21.7
- Spread (SD)
- 2.8
- Fastest pace so far
- 8 sprints
- Slowest pace so far
- 10 sprints
- Plan for next sprint
- 21.7 points
- Sprints in history
- 6
Velocity forecasts a team against itself. It is not a measure to compare teams.
Send this forecast to OceanLab
Opens an email to OceanLab with this result and a link to your inputs. Nothing is sent until you press send, and there is no sign-up.
How this is calculated
Average velocity = points finished across recent sprints ÷ number of sprints. The spread is the sample standard deviation.
Sprints to finish = backlog ÷ velocity, rounded up, at the average pace and at your slowest and fastest sprints so far.
The next sprint's plan = average velocity × capacity, for holidays or leave.
The default sprint history is an example. Use your own team's numbers.
Questions about this tool
How many sprints of history do I need?
Three is a start; five or six give a steadier average. Drop sprints that were very unusual, such as a release freeze.
Can I compare velocity between teams?
No. Points are relative to each team. Velocity forecasts a team against its own past, not against other teams.
What if the backlog keeps growing?
Re-run the forecast each sprint with the new backlog size. A backlog that grows faster than velocity never finishes.
Is anything I enter sent anywhere?
No. The tool runs in your browser and there is no sign-up. Nothing leaves the page unless you choose to email your result to OceanLab.
Other free tools
OceanLab product builds like this
Products OceanLab designed and built. Each case study covers the screens, the scope and the rules it was built for.
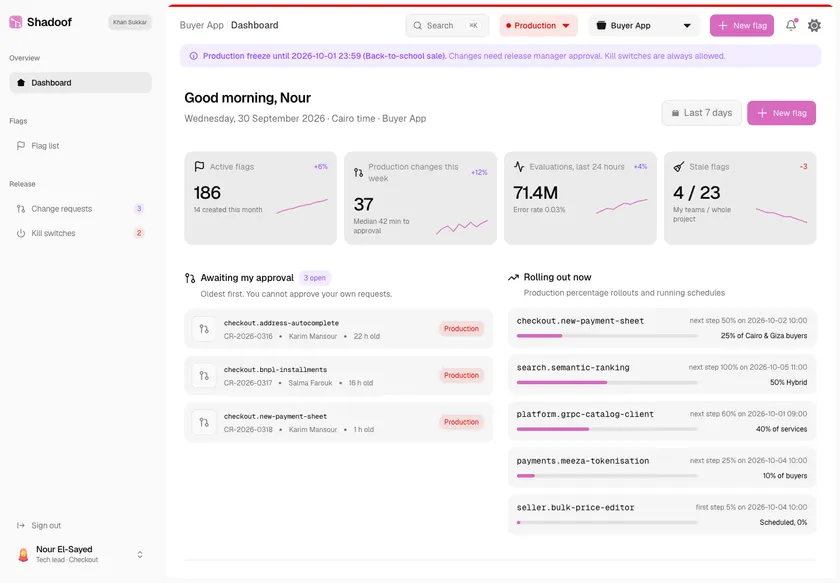
Shadoof - Feature Flag and Progressive Delivery Service for a Marketplace's Engineering Teams
Designed and built a clickable feature flag console for the engineering teams of a Cairo online marketplace: targeting rules and sticky percentage rollouts per environment, change requests with a second approver for Production, kill switches for incidents and a full change history for every flag.
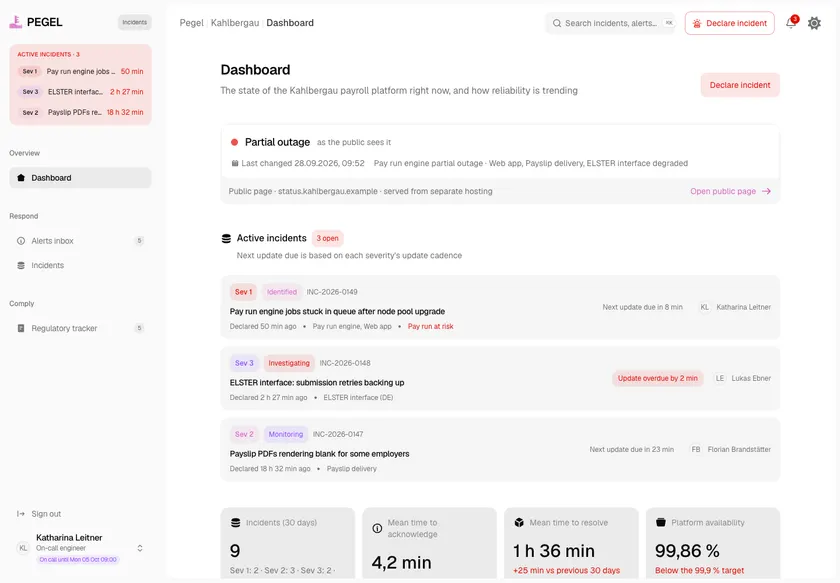
Pegel - Incident Management and Status Page for a Payroll SaaS
Designed and built a clickable incident management console for a Vienna payroll SaaS serving about 1,400 employers in Austria, Germany and Switzerland: one alerts inbox, an incident room with roles, timeline and update cadence, and a regulatory tracker that keeps GDPR, NIS2 and DORA contract notices on their deadlines.
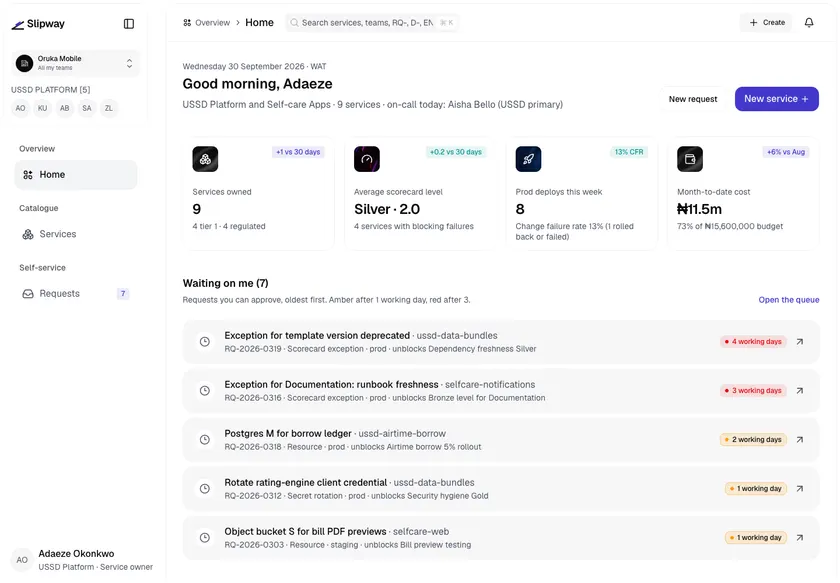
Slipway - Internal Developer Platform with a CLI and Service Catalogue
Designed and built a clickable internal developer platform for a Lagos mobile network operator: a service catalogue with owners, tiers and scorecards, self-service requests with approval policies for production resources and tier 1 deploys, and a slip command line tool whose exact command is shown on every page.
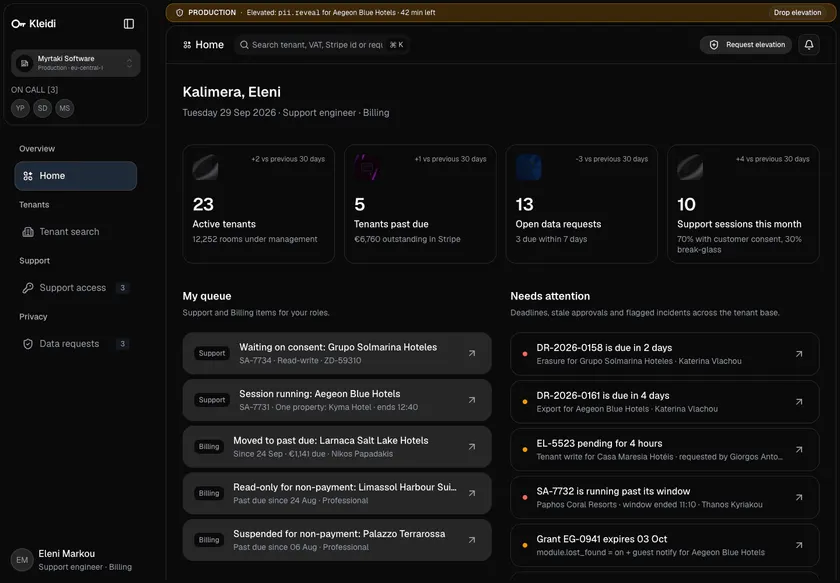
Kleidi - SaaS Admin Console with Consented Support Access and a Full Audit Trail
Designed and built a clickable internal admin console for an Athens SaaS company that sells housekeeping software to EU hotels: find any tenant and see everything about it on one page, enter a customer's workspace only with their consent, work GDPR data requests on the clock, and give staff elevated rights only for a limited window with someone else's approval.
