Guadua - Shared E-Scooter and E-Bike Operations Console for Bogotá
Micromobility Operator Console for a Bogotá Fleet
Designed a shared e-scooter and e-bike platform for a Bogotá operator running about 4,000 scooters and 1,500 e-bikes under a district permit, and built its clickable operator console: a dashboard that watches the permit's limits, a live fleet map with IoT state and alarms, vehicle records, and a planner that sends crews to swap batteries and rebalance where demand is forecast.
Most of our work is under NDA. Per agreement, we can share the work but not the company details - all names and identifying information shown here have been changed.
Impact
Dashboard, live fleet map, vehicles list, vehicle detail with 5 tabs and the rebalancing and swap planner. Every one of the 56 demo vehicles opens its own detail page.
Fleet caps of 4,000 e-scooters and 1,500 e-bikes, a vehicle limit for each of 9 Bogotá localities, and a target of at least 35% of rides ending in preferred parking.
Service area, slow, no-ride, no-parking, preferred parking and deploy spots, each with its time window and its source: a district request reference or the operator. Slow zones cap speed at 10 to 15 km/h.
42 e-scooters and 14 e-bikes with live IoT state, 7 alarm types, 3 battery hubs, 6 crews with vans, 24 tasks across 8 task types and a demand forecast over 145 hex cells.
The Problem
Frailejón Movilidad won its Bogotá permit on the promise of tidy parking, safe speeds and good data, but ran on a white-label rider app, the scooter maker's IoT dashboard, WhatsApp groups for field crews and workshop spreadsheets. Zones were redrawn in three tools whenever the district changed a rule, crews swapped batteries on whatever vehicles they drove past, about a fifth of the fleet sat below 15% charge at the morning peak, and the monthly city report took two analysts a week to assemble by hand.
Our Solution
Guadua puts the rider app, the field crew app and the operator console on one platform. The console shows every vehicle's battery, location and alarms on a live map, keeps the permit's limits in view on the dashboard, and plans battery swaps and rebalancing from forecast demand per map cell, so crews go where riders will be.
The Challenge: Running a Fleet Inside a City Permit
A shared micromobility operator in Bogotá answers to the district permit, national rules for light electric vehicles, Colombian data protection law and its riders at the same time, while thousands of vehicles move, drain and fall over across the city every hour.
Zones That Lagged Behind the Permit
The district asks for slow zones, no-ride areas and parking rules, often with time windows. Each change had to be redrawn in three tools, so the speed caps on the street trailed what the permit required.
Batteries Swapped by Chance
Crews swapped batteries on vehicles they happened to pass, not on the ones riders would need next. About a fifth of the fleet sat below 15% charge at the morning peak, with no view of van capacity or battery stock.
Complaints Reached the City First
Badly parked vehicles were reported to the district before the operator saw them. There was no single queue for flagged parking photos, city complaints and the crew tasks needed to move a vehicle out of a no-parking zone.
City Data Without Rider Data
The permit expects regular data, but trip routes reveal where people live and work, and Law 1581 of 2012 protects them. The city needs an MDS-style feed with no rider identifiers, rounded times and places, and small counts suppressed.
Our Approach: From Permit Rules to a Clickable Console
Spec and Rules Research
Mapped 11 user roles plus the city as a feed consumer, 52 screens across the rider app, the field crew app and the operator console, and the data model for vehicles, telemetry, alarms, versioned zones, permit conditions, price books, rides, parking checks, tasks, crew shifts and demand forecasts. Wrote down the rules the design follows: Law 1581 of 2012, Law 2486 of 2025 and its 2026 resolution, the Consumer Statute, the district permit's conditions, the MDS data feed and DIAN electronic invoicing.
Clickable Demo on a Production UI Kit
Built the operator console's 5 key screens on a production dashboard kit over a schematic map of north and central Bogotá: the dashboard with KPIs, fleet by status, permit gauges and a needs-attention list, the live fleet map with layers, filters and a vehicle quick view, the vehicles list, vehicle detail with IoT, rides, service, telemetry and activity tabs, and the planner with its target map, suggested tasks and crew board. Accepting, reassigning and cancelling tasks run on local state.
What a Production Build Adds
Integration with the vehicle makers' IoT clouds (such as Segway-Ninebot or Okai), Mapbox or Google Maps, a route optimiser such as Google Route Optimization or VROOM, Truora or MetaMap for the age check, Wompi or PayU with Nequi and Daviplata, Siigo or Alegra for DIAN invoices, and an on-device parking photo model. Staff roles, zone publishing with a second approver, an audit and privacy log, the MDS-style city feed, the rider app, the offline-capable crew app and the remaining console pages.
Why It Works: The Permit, the Fleet and the Crews in One Place
The Permit Is Always in View
Every page carries a permit status chip, and the dashboard shows deployed scooters and e-bikes against their caps, each locality against its limit and the preferred-parking share against its target. Permit conditions are stored as editable rules, never hard-coded numbers.
Swaps Go Where Riders Will Be
The planner compares forecast rides per hex cell with the vehicles there now, marks cells short or over-supplied, and suggests swaps for vehicles projected below the 25% threshold, ranked by forecast demand. The crew board shows each van's capacity, charged and depleted batteries and route.
Speed Caps Come From Zones
Each zone carries its type, speed cap, time window, status and the district request it came from, and a vehicle shows the cap applied to it and why. The product never states a legal speed as fact: the operator sets caps per zone to match the rules.
Riders Stay Private
Riders appear masked in a vehicle's ride history, GPS is collected only during rides and servicing, raw routes are thinned to start and end points after 90 days, and the city feed carries no rider identity.
Related case studies
View all: Mobility & EV
DriveLuxe - All-Electric Premium Ride-Hailing for Hong Kong
Built a rider mobile app for an all-electric premium ride-hailing service - live EV map, charge-aware vehicle selection, real-time booking, and trip-completion CO₂ accounting - shipped from clickable AI prototype to App Store in 10 weeks.
Voltone - Electric Car Sharing Platform with Telematics, Damage and Fines Control
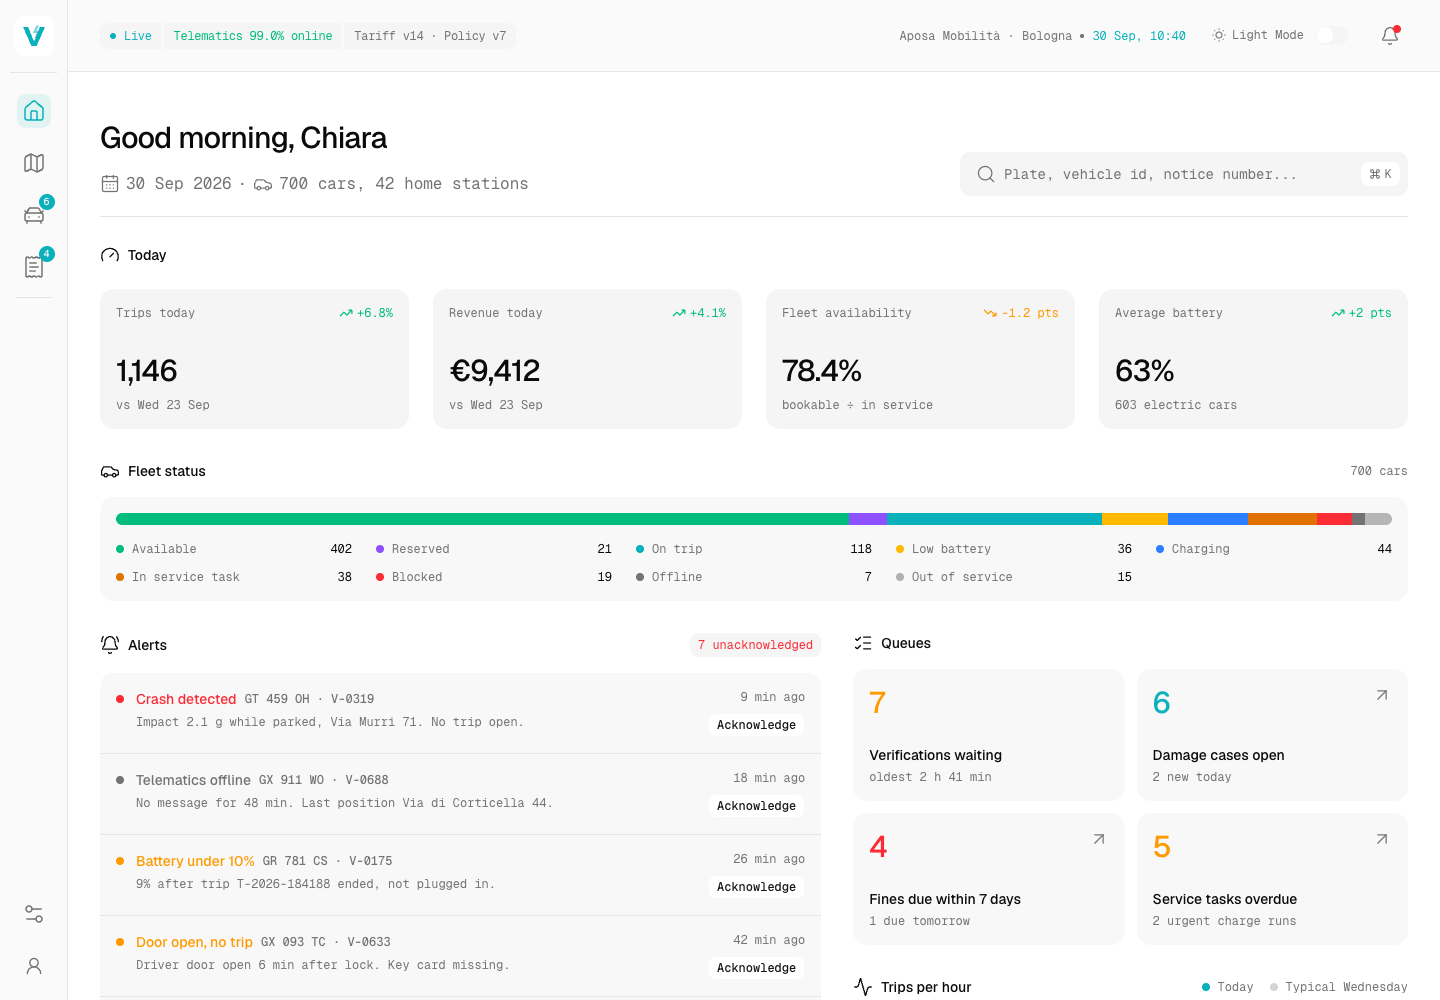
Designed a car sharing platform for a Bologna operator of about 700 mostly electric cars and built its operator console as a clickable demo: a live fleet map with telematics and remote commands behind safeguards, damage reviews that compare before and after photos, and a fines desk sorted by the deadline to identify the driver.
Enterprise Software Engineering - Human + AI
Contact Us
© 2026 - Copyright. All Rights reserved Oceanlab
Location
Global Headquarters
21 Merchant Road, 3rd Floor, Singapore 058267
Main corporate office and leadership operations
North America Office
548 Market Street, PMB 12345, San Francisco, CA 94104
Client operations and business development
India Office
402 Shivalik Shilp II, SG Highway, Ahmedabad 380015
Engineering and delivery center

Enterprise Software Engineering - Human + AI
Contact Us
Locations
Global Headquarters
21 Merchant Road, 3rd Floor, Singapore 058267
Main corporate office and leadership operations
North America Office
548 Market Street, PMB 12345, San Francisco, CA 94104
Client operations and business development
India Office
402 Shivalik Shilp II, SG Highway, Ahmedabad 380015
Engineering and delivery center
© 2026 - Copyright. All Rights reserved Oceanlab