Reefline - Reef Survey and Validation Console for a Fijian Marine Trust
Reef Monitoring Platform for a Fijian Conservation Trust
Designed and built a clickable scientist console for a Suva marine conservation trust that monitors 60 reef sites with volunteer and professional divers: a validation queue for submitted dives, a survey review that locks until every AI-suggested quadrat point is confirmed by a person, a site map with community consent and permit status, and NOAA Coral Reef Watch heat stress shown as published.
Most of our work is under NDA. Per agreement, we can share the work but not the company details - all names and identifying information shown here have been changed.
Impact
Dashboard, validation queue, survey review with 6 tabs (fish, invertebrates and COTS, benthic cover, bleaching, photos, history), sites on a map or table, and heat stress.
4 transects of 20 quadrats with 25 points each. Validate stays locked until every point is confirmed, as on SV-2026-0428 with 460 points still in the classification queue.
Sites counted from No Stress to Alert Level 2, Degree Heating Weeks over 12 weeks with the DHW 4 and 8 lines, and a warning when the satellite data is older than 48 hours.
24 of the trust's 60 sites with 12 weeks of heat stress readings, 23 surveys, 12 divers, 6 staff, 9 qoliqoli with consent records and 3 alerts.
The Problem
Lomacakau's divers wrote counts on underwater slates, copied them onto paper datasheets on the boat and typed them into one of four spreadsheet versions weeks later. Quadrat photos sat on personal SD cards and one science officer scored benthic cover point by point for months. When the 2024 heat stress season arrived, nobody could say which sites had been surveyed since the last bleaching event, which villages had been told, or whether a crown-of-thorns starfish sighting had been followed up.
Our Solution
Reefline is planned as an offline-first diver app, a scientist console and a public reef health dashboard. The build is the scientist console: science officers work a queue of submitted dives, review every section against the site's history, confirm AI-suggested benthic points before cover is counted, see which sites are blocked by consent or permit, and read satellite heat stress beside the in-water surveys.
The Challenge: Reef Data From Slate to Science
Reef monitoring in Fiji depends on volunteer divers, customary fishing grounds held by iTaukei communities, satellite heat stress data and a scientific method that has to stay comparable for years. Every survey has to respect all four.
Counts That Got Lost on the Way
Fish, invertebrate, bleaching and photo quadrat data passed from slate to paper to spreadsheet, often after the slate had been wiped. A transect nobody searched looked the same as a transect with zero fish, and outliers were found months later, if at all.
Surveys Only With Community Consent
Most inshore reefs sit within qoliqoli, customary fishing areas. Surveying there is generally done only with the free, prior and informed consent of the resource-owning community, and some sites also need a research or protected area permit that can expire.
AI That Must Not Become the Result
Scoring benthic cover by hand took months, but automated classification of photo points is only a suggestion. A trained person has to confirm or correct every point before cover enters the validated dataset, with a record of who did it.
Satellite Signals Versus Reef Reality
NOAA Coral Reef Watch publishes daily sea surface temperature anomalies, Degree Heating Weeks and Bleaching Alert Area levels. They are regional indicators that must never be relabelled and have to be confirmed by in-water surveys before the trust raises its own alerts.
Our Approach: From Reef Protocol to a Clickable Console
Spec and Rules Research
Mapped 9 roles from volunteer diver to data manager, 40 screens across the diver app, scientist console and public dashboard, and the data model for sites, transects, qoliqoli consent, permits, dive logs, counts, quadrat points, heat stress readings, alerts and sharing agreements. Wrote down the rules the design follows: diver safety first, privacy by design, qoliqoli consent, research permits, NOAA levels as published, versioned survey protocols and AI as a suggestion only.
Clickable Demo on a Production UI Kit
Built the scientist console's 5 key screens on a production dashboard kit: the dashboard with KPIs, a map of sites by hard coral cover, My work by role and survey coverage by island group, the validation queue with quick view, the survey review with dive logs, outlier flags and the 0 to 5 bleaching scale, sites with access status, and heat stress with alert and urgent survey actions. Validate, return, reject and value edits run on local state.
What a Production Build Adds
The offline-first diver app and the public dashboard in English and Fijian, the classification queue and quadrat workbench, daily NOAA Coral Reef Watch fetches, a benthic classifier such as CoralNet or ReefCloud, offline map tiles, UDDF dive log import, GBIF and OBIS publishing through Darwin Core, photo storage, SMS alerts to village focal points, staff and diver sign-in, and a tamper-evident audit log.
Why It Works: Science Checked by People
Validation Waits for Every Point
Benthic cover is computed only from points a person has confirmed. Until then the survey review shows how many points are still in the classification queue and the Validate button stays locked, as do surveys with a blocking flag such as an empty transect.
Outliers Flagged Against Site History
Each fish and invertebrate count sits beside the site's previous range, so a parrotfish count of 31 against a range of 2 to 9 stands out. COTS density per hectare is shown against the trust threshold, and a science officer's edit keeps the diver's original value and the reason.
Consent and Permits Gate the Site
Every site shows its qoliqoli consent, permit status and conditions such as no surveys on Sundays. A site with withdrawn consent or an expired permit is marked blocked with the reason, and new sites stay blocked until both are recorded.
Heat Stress Kept Honest
NOAA levels are shown exactly as published with the source and fetch time, next to days since the last in-water survey at each site. A reminder line says satellite values are regional indicators, and alerts raised from the screen copy the evidence at raise time.
Related case studies
View all: Climate & nature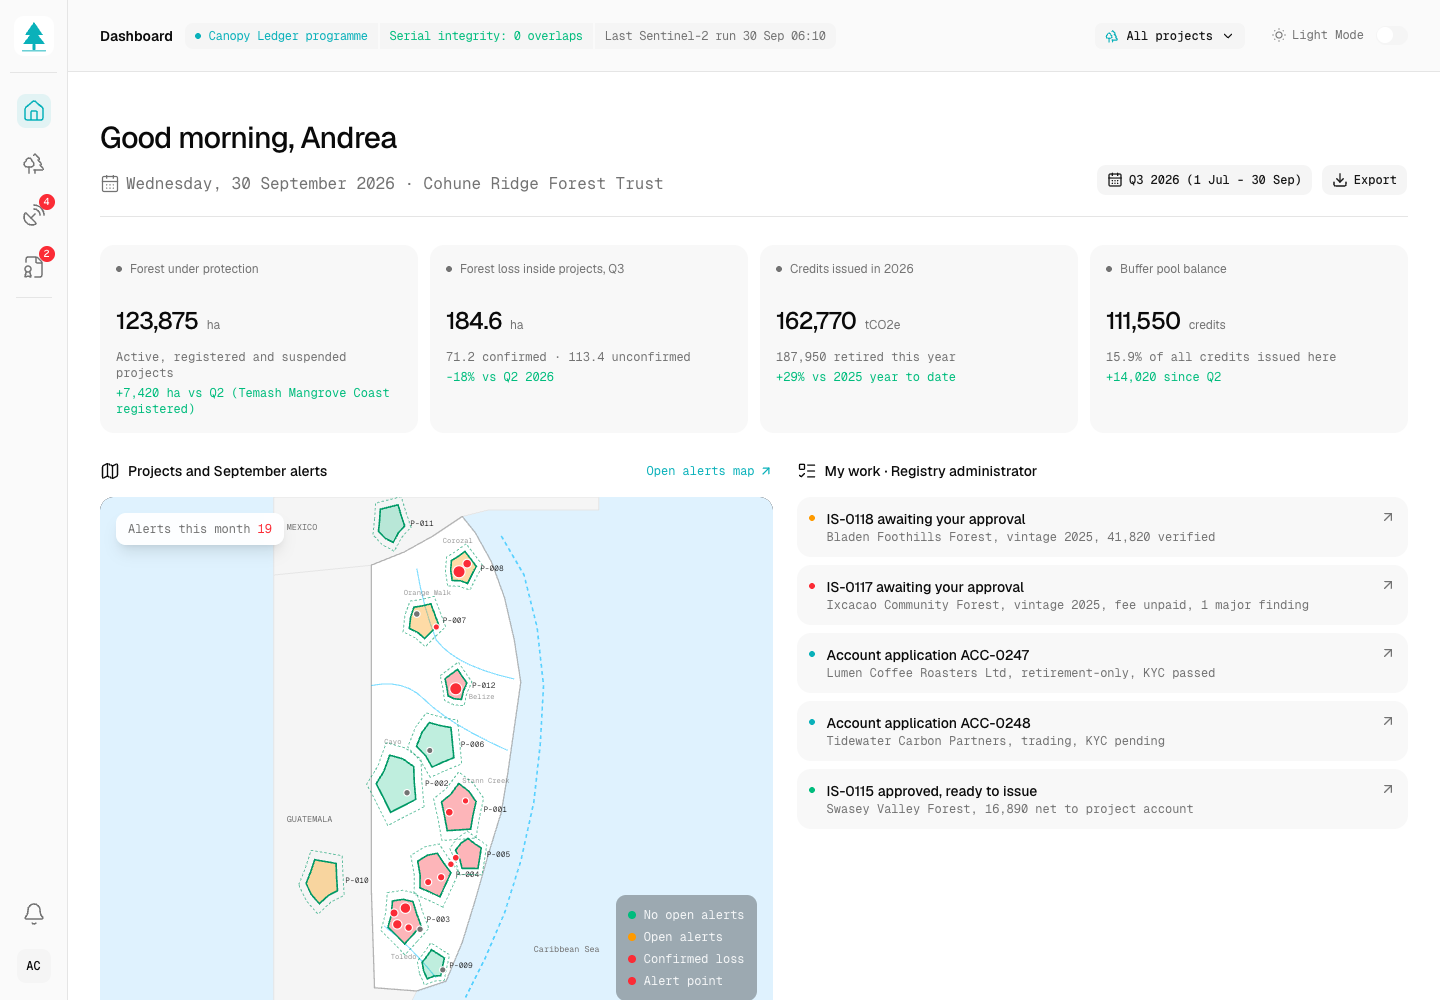
Canopy Ledger - Forest Carbon Credit Registry with Satellite Monitoring
Designed and built a clickable registry and monitoring platform for a Belize forest carbon developer: every community forest project with its boundary and methodology, satellite forest-change alerts triaged to ground-truth, and issuance requests that only create serial numbers after a four-eyes check against verification, consent and double counting.
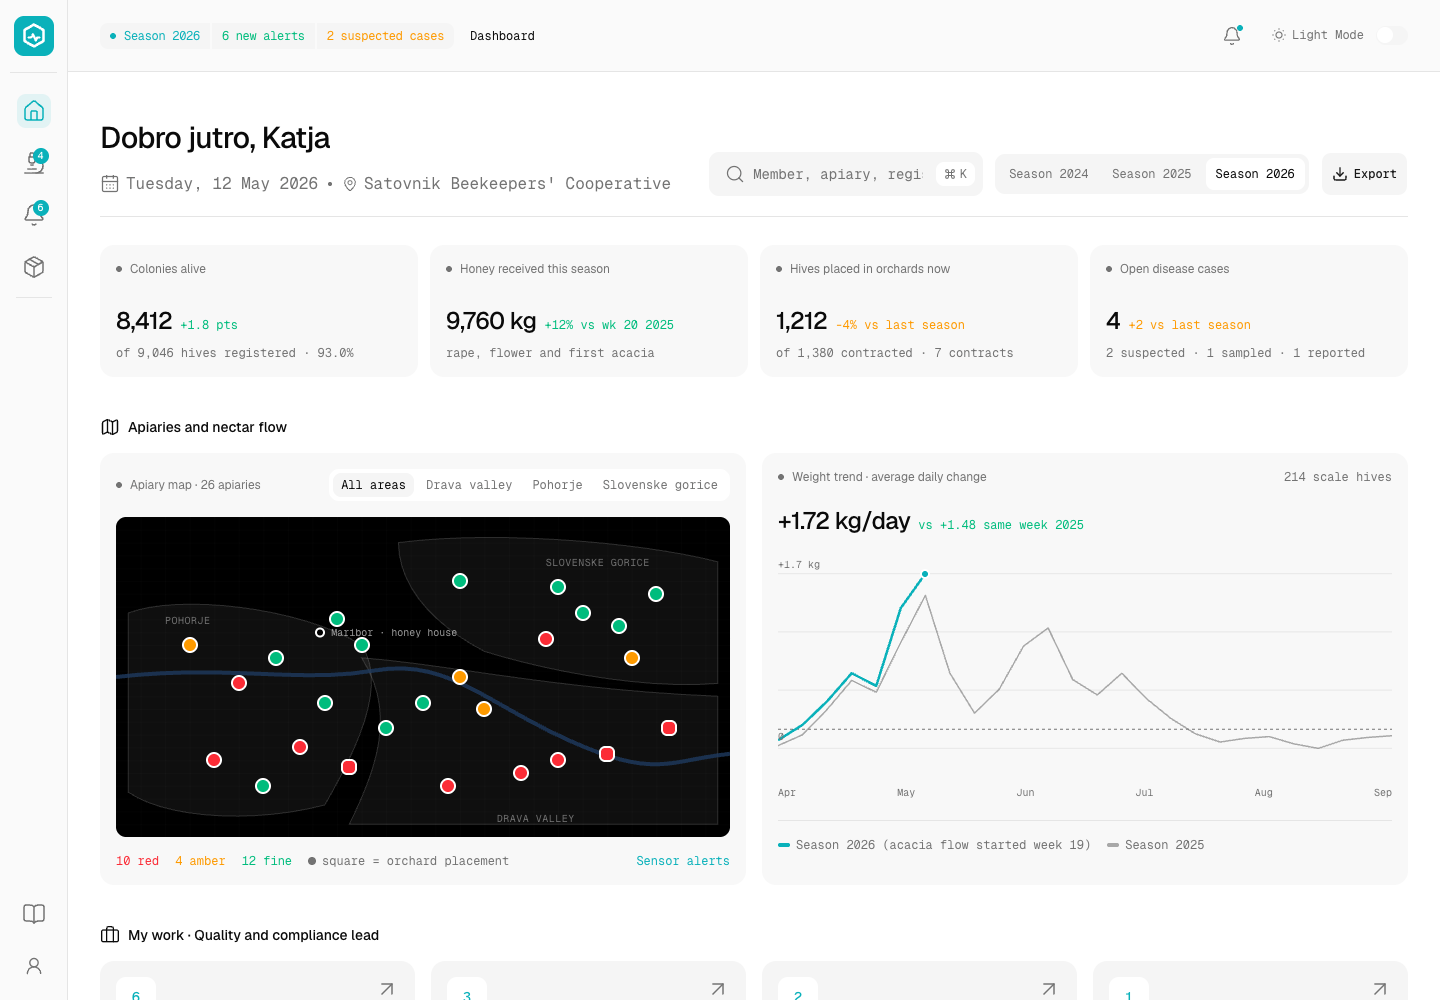
Hivewise - Hive Monitoring and Honey Traceability Platform for a Beekeeping Cooperative
Designed and built a clickable hive monitoring console for a beekeeping cooperative in Maribor, Slovenia: alerts from hive scales and climate sensors, notifiable disease cases up to the handoff to the official vet, honey intake with withdrawal and disease checks, and a batch trace from every jar lot back to the hives and members behind it.
Enterprise Software Engineering - Human + AI
Contact Us
© 2026 - Copyright. All Rights reserved Oceanlab
Location
Global Headquarters
21 Merchant Road, 3rd Floor, Singapore 058267
Main corporate office and leadership operations
North America Office
548 Market Street, PMB 12345, San Francisco, CA 94104
Client operations and business development
India Office
402 Shivalik Shilp II, SG Highway, Ahmedabad 380015
Engineering and delivery center

Enterprise Software Engineering - Human + AI
Contact Us
Locations
Global Headquarters
21 Merchant Road, 3rd Floor, Singapore 058267
Main corporate office and leadership operations
North America Office
548 Market Street, PMB 12345, San Francisco, CA 94104
Client operations and business development
India Office
402 Shivalik Shilp II, SG Highway, Ahmedabad 380015
Engineering and delivery center
© 2026 - Copyright. All Rights reserved Oceanlab