Kolmila - GHG Inventory and Sustainability Reporting Platform with Evidence Behind Every Number
Carbon Reporting Platform for a Swedish Manufacturing Group
Designed and built a clickable sustainability data platform for a Swedish manufacturer of hydraulic cylinders, steel fabrications and castings: site data collection with evidence, two-step review, a versioned emission factor library and a Scope 1, 2 and 3 inventory under the GHG Protocol, built to feed an ESRS sustainability statement and limited assurance.
Most of our work is under NDA. Per agreement, we can share the work but not the company details - all names and identifying information shown here have been changed.
Impact
Dashboard, collection plan, activity data, the activity record with its evidence viewer and calculation card, and the inventory overview. Every record in the activity table opens its own page.
Both methods sit side by side on the dashboard and the inventory: 4 028,8 and 2 350,9 tCO2e for January to August. A renewable claim without cancelled guarantees of origin falls back to the residual mix.
More than 30% away from the same month last year, overlapping periods on one meter, missing months and a unit mismatch against the meter. The record page also flags where the entered quantity differs from the invoice.
Activity records across 10 sites in Sweden, Finland, Poland and Germany, 15 emission factors with source, version and licence, 27 collection tasks and 16 staff users.
The Problem
Stensjövik built its sustainability report each spring from 40 spreadsheets emailed by site controllers. Electricity was typed from PDF invoices, diesel came from fuel card exports in three formats, Scope 3 was a spend-based estimate in one analyst's workbook, and emission factors were pasted in with no source or year. When the auditor asked why Scope 2 had dropped 18%, it took two weeks to find a site using a renewable factor without the guarantees of origin to back it.
Our Solution
Kolmila takes a number from a meter reading or an invoice to a reported total. Sites enter or upload activity data with evidence, the site controller and then the group analyst approve it, every record is calculated against a versioned factor, and the inventory shows Scope 1, both Scope 2 methods, Scope 3 and biogenic CO2 with the run, boundary and methodology version behind them.
The Challenge: Every Number Has to Trace Back
Customers send carbon questionnaires, the group's bank has priced a sustainability-linked loan on Scope 1 and 2 reductions, and the CSRD will require an assured sustainability statement. Each reported figure has to lead back to evidence, a factor and the person who approved it.
Ten Sites, One Close
Six plants, two warehouses and sales offices in four countries report energy and fuels monthly, waste and refrigerants quarterly, and Scope 3 and ESG datapoints yearly. Each month runs on the same close: site submission, site review, group review and a year-end lock that needs two approvers.
Scope 2 Reported Two Ways
The GHG Protocol Scope 2 Guidance expects location-based and market-based figures. A market-based renewable claim only counts with guarantees of origin cancelled for the right period, which in Sweden happens in the Swedish Energy Agency's registry.
Factors With a Source and a Licence
Grid, residual mix and fuel factors come from the IEA, the AIB, the Swedish Energy Agency and DESNZ, each with its own year, version and terms. IEA and ecoinvent values are licensed and generally cannot be redistributed, so exports have to respect that.
A Framework Still Moving
The stop-the-clock directive postponed the group's first CSRD year and the 2026 Omnibus narrows scope and simplifies the ESRS. Until the final position is confirmed, the group reports under the Swedish Annual Accounts Act, chapter 6, while collecting ESRS-structured data in parallel.
Our Approach: From Carbon Accounting Rules to a Clickable Platform
Spec and Rules Research
Mapped 11 user roles, including an assurance provider portal and supplier magic links, and 39 screens with their panels and modals. Defined the data model for boundary versions, sites and supply points, activity records and evidence, emission factors and mapping rules, calculation runs, supplier requests, targets, materiality and an append-only audit trail. Wrote down the rules the design follows: the GHG Protocol Corporate, Scope 2 and Scope 3 standards, base year recalculation, CSRD and ESRS, SBTi targets, EU ETS reconciliation and GDPR.
Clickable Demo on a Production UI Kit
Built 5 key screens on a production dashboard kit: the dashboard with five KPI cards, emissions by month, collection progress by site, a target tracker and a needs attention list; the collection plan with its site by month matrix and close timetable; activity data with status counts, anomaly flags and bulk approval of clean records; the activity record with evidence, data quality reasons and a calculation trace; and the inventory overview with scope totals, a breakdown table, gases and intensity. All actions run on local state and factor values are illustrative.
What a Production Build Adds
Integration with the ERP (IFS Cloud or SAP S/4HANA), utility and meter exports, fuel card and travel reports, invoice extraction through a document AI service, licensed and open factor sources, guarantee of origin cancellation statements and CDP supplier responses. Microsoft Entra ID sign-in by role and site, the supplier and auditor portals, the remaining screens from boundary to the ESRS statement builder, a hash-chained audit trail and XBRL-ready export to the annual report tool.
Why It Works: Evidence Before Approval
The Invoice Sits Next to the Entry
The record page shows the evidence with the extracted meter, period and consumption highlighted, and puts the extracted quantity beside the entered one. When a site types 402 150 kWh and the invoice says 420 150 kWh, the 18 000 kWh difference is flagged before anyone approves it.
Each Total Shows How It Was Made
Every record shows quantity times factor equals result, split by gas, with the factor id, version and source, the GWP set and the methodology version. Licensed factor values are masked rather than shown. The inventory names its boundary version and calculation run, and lists what changed since the last run with its effect.
Problems Surface Before the Close
The dashboard lists records on fallback factors, market-based claims without cancelled guarantees of origin, sites past their due date, supplier requests unanswered after 21 days and auditor requests past their agreed date. Sites under 50% within 10 days of their due date turn amber.
Quality Is Scored, Not Assumed
Each record carries a 1 to 5 data quality score with the reasons, its method (measured, invoiced, estimated or supplier reported) and its source. The inventory reports weighted data quality and the share estimated for every scope and category, so the weak spots in Scope 3 are visible.
Related case studies
View all: Procurement & ESG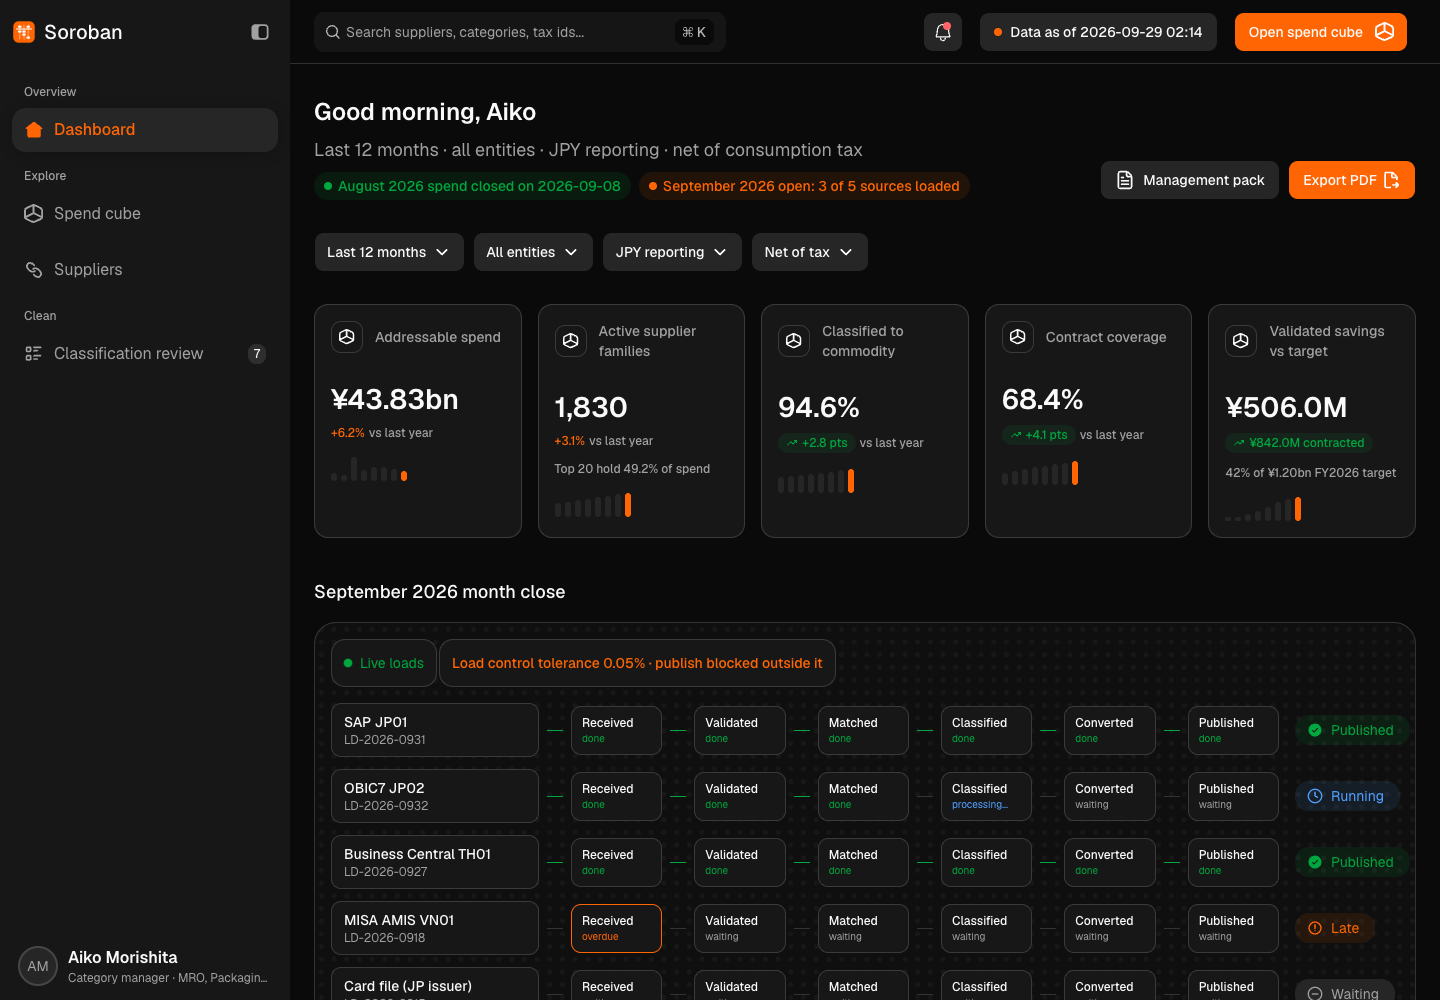
Soroban - Group Spend Analytics Across Four ERPs
Designed and built a clickable spend analytics platform for an Osaka trading and manufacturing group with companies in Japan, Thailand and Vietnam: messy vendor records from four ledgers folded into supplier families, every line classified to UNSPSC and converted to yen, and one spend cube to slice it by category, supplier, entity and period.
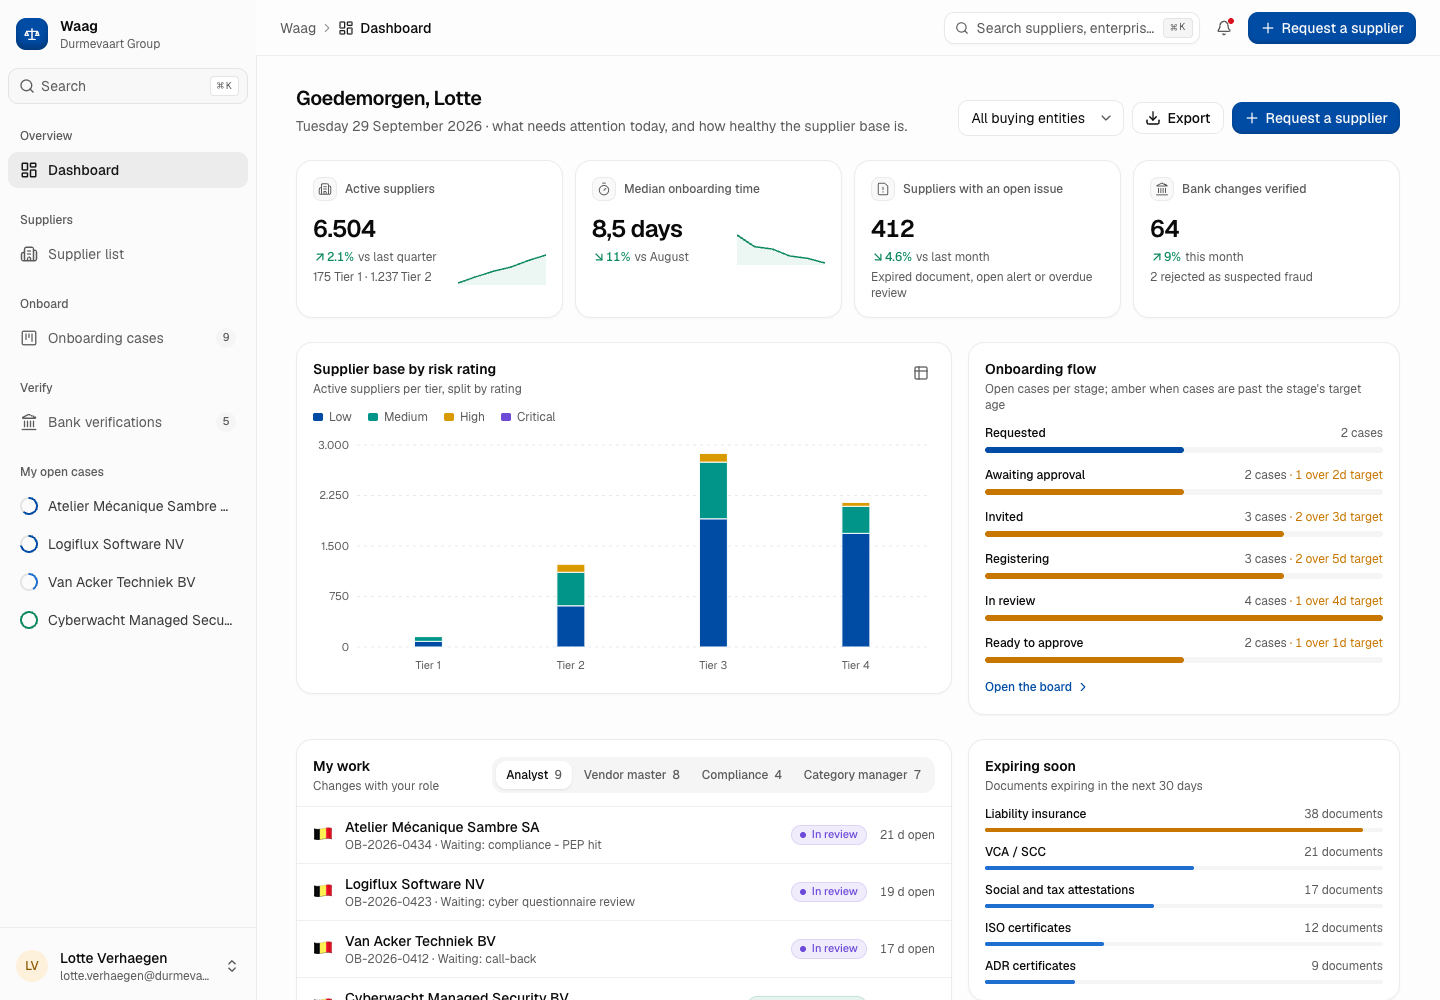
Waag - Supplier Onboarding and Third-Party Risk Platform
Designed and built a clickable supplier onboarding and third-party risk platform for a Belgian industrial and logistics group: a 10-item onboarding checklist from request to approved vendor, registry, VAT and ownership checks, bank details confirmed by an independent call-back and a second person, and a supplier base scored by tier and risk rating.
Enterprise Software Engineering - Human + AI
Contact Us
© 2026 - Copyright. All Rights reserved Oceanlab
Location
Global Headquarters
21 Merchant Road, 3rd Floor, Singapore 058267
Main corporate office and leadership operations
North America Office
548 Market Street, PMB 12345, San Francisco, CA 94104
Client operations and business development
India Office
402 Shivalik Shilp II, SG Highway, Ahmedabad 380015
Engineering and delivery center

Enterprise Software Engineering - Human + AI
Contact Us
Locations
Global Headquarters
21 Merchant Road, 3rd Floor, Singapore 058267
Main corporate office and leadership operations
North America Office
548 Market Street, PMB 12345, San Francisco, CA 94104
Client operations and business development
India Office
402 Shivalik Shilp II, SG Highway, Ahmedabad 380015
Engineering and delivery center
© 2026 - Copyright. All Rights reserved Oceanlab