Cadran - Machine Telemetry and OEE Platform for an Injection Moulding Plant
Live OEE and Losses for an Automotive Plastics Plant
Designed and built a clickable machine telemetry and OEE platform for a Romanian injection moulding and assembly plant that supplies automotive Tier 1 customers: live state of 60 moulding machines and 8 assembly lines, OEE with availability, performance and quality per machine, line and shift, a queue for clearing unclassified stops and a Pareto of top losses.
Most of our work is under NDA. Per agreement, we can share the work but not the company details - all names and identifying information shown here have been changed.
Impact
Plant overview, machines floor map, machine detail with 6 tabs, unclassified stops and top losses. Every machine and line tile opens a quick view, and each of the 60 moulding machines has its own detail page.
Every OEE figure shows availability, performance and quality beside it and opens a breakdown with the formula filled in. Areas are aggregated by time, not averaged, and performance above 100% is capped and flagged.
9 categories and 22 sub-reasons in Romanian and English, with 11 alarm and signal codes mapped to a suggested reason so a stop can be classified in one tap.
60 moulding machines in two halls and 8 assembly lines, each with a full shift timeline of stops and micro-stops, 5 floor gateways, 19 parts for 4 customers and 15 staff users.
The Problem
Frăsinet's shift leaders filled in paper production sheets per machine that were typed into a spreadsheet the next morning, often two days late. Stops under 10 minutes were rarely written down, so reported OEE looked better than output said it should. Changeovers had no agreed start and end, a third of scrap was logged as "other", and when an assembly line waited for moulded parts nobody could show which machine caused it.
Our Solution
Cadran reads machine states and counts from the floor through OPC UA and MQTT gateways, read-only, and turns them into live OEE, top losses and output against plan per machine, line and shift. Operators classify stops on a line-side tablet, shift leaders clear what is left from one queue, and every OEE number shows the three factors behind it.
The Challenge: One Set of Numbers for the Whole Floor
A plant with 60 moulding machines, 8 assembly lines and 3 shifts produces thousands of stops a week. Management argued about the numbers instead of the losses, and customer delivery audits kept asking for evidence the plant could not produce quickly.
OEE That Hid Its Losses
OEE is availability × performance × quality. For injection moulding the ideal cycle time is set per shot for each mould and part, and a shot makes as many parts as the mould has active cavities. A wrong ideal or a blocked cavity quietly distorts the number, so OEE alone tells a manager very little.
Stops Nobody Classified
Short stops went unrecorded and longer ones were often left without a reason. The product needed a reason tree an operator in gloves can use in seconds, a suggested reason from the machine's own alarm, and an escalation when a stop stays unclassified past the plant's policy time.
Mixed Machines, Read-Only Data
Newer Engel, Arburg and KraussMaffei controllers speak OPC UA per Euromap 77, while older machines and assembly PLCs only give digital signals through a gateway. Cadran must never write a set point, start or stop a machine, or touch a safety function.
Operator Data Under GDPR
Who classified a stop or logged scrap is personal data. In Romania, Law 190/2018 adds conditions for employers that monitor employees electronically, and the Labour Code expects staff to be informed. Cadran reports by machine, line and shift and does not rank individual operators.
Our Approach: From Plant-Floor Rules to a Clickable Platform
Spec and Rules Research
Mapped 10 user roles, from operator and setter to plant manager and data protection lead, and 41 screens: 34 web console screens and 7 line-side tablet screens. Defined the data model for machines, lines, moulds, parts, state rules, stop events, changeovers, scrap and Andon calls, and wrote down the rules the design follows: the OEE definition, micro-stops under 120 seconds counting against performance, GDPR with Law 190/2018, the Labour Code and IATF 16949.
Clickable Demo on a Production UI Kit
Built 5 key screens on a production dashboard kit: the plant overview with KPI cards, a 68-tile machine state strip, open Andon calls and needs-attention items, the machines floor map and table, machine detail with a state timeline and tabs for stops, cycles, counts, changeovers, signals and notes, the unclassified stops queue with suggestions and bulk classify, and the top losses Pareto with drill-down. Classifying a stop updates the badge, tables and losses everywhere; all actions run on local state.
What a Production Build Adds
Edge gateways such as Kepware KEPServerEX or Softing edgeConnector, an MQTT broker, SAP S/4HANA production orders, Maximo or Fiix maintenance handoff, optional energy meters, Microsoft Entra ID for office staff, and Teams and Twilio for Andon messages. Plus the glove-friendly line-side tablet with badge and PIN sign-in and offline queueing, changeovers, scrap, shift handover, reports, versioned settings, privacy and retention controls, and a full audit log.
Why It Works: Losses You Can Trust
The Formula Is Always Visible
Every OEE number carries its A, P and Q and opens a breakdown with planned time, run time, stops, ideal cycle, counts and the formula with the values filled in. A machine running faster than its ideal is flagged as a sign the ideal cycle time is wrong, rather than counted as a win.
Every Stop Gets a Reason
Stops of 120 seconds or more need a reason, and those still unclassified 15 minutes after they end escalate to the shift leader. The queue shows the signal at the time, such as an active alarm or a changed mould id, with a suggested reason to accept in one tap or apply to several stops at once.
The Floor at a Glance
The overview and floor map show all 60 machines and 8 lines by hall, each with a state word and colour, time in state, mould, part and cycle time against ideal. Overdue unclassified stops pulse, and a data freshness indicator shows when a gateway is late before anyone trusts a stale number.
Read-Only by Design
Signals are shown exactly as mapped from the controller, and no write tags exist in the data model. Targets, the micro-stop threshold and escalation time are labelled as the plant's own policy, and reporting stays at machine, line and shift level so the tool measures losses, not people.
Related case studies
View all: Manufacturing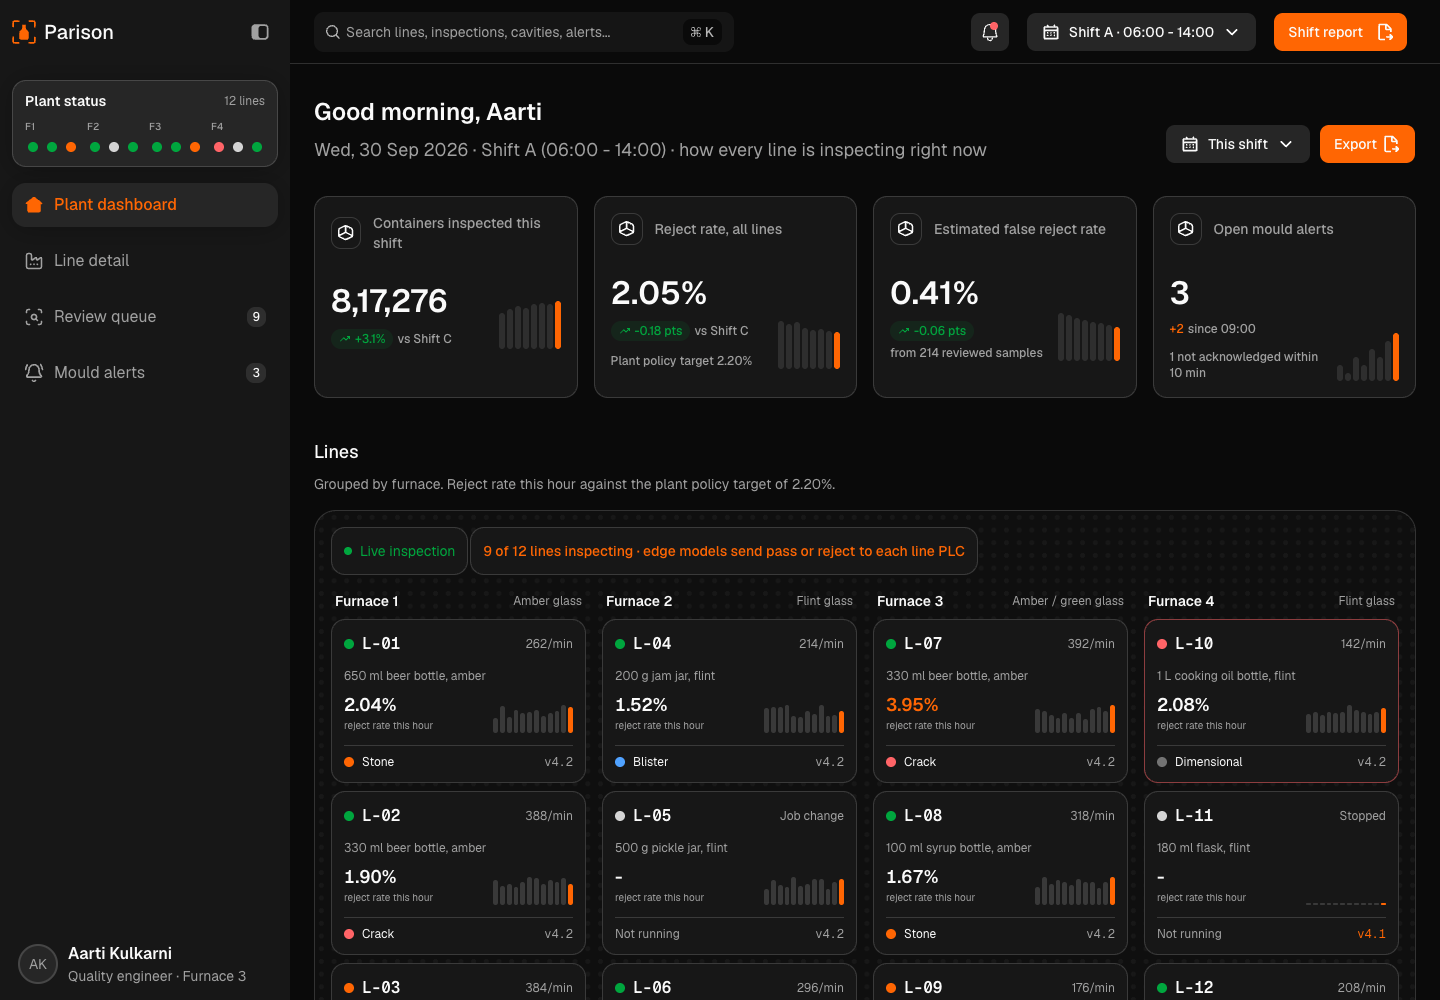
Parison - AI Visual Inspection for Glass Bottle and Jar Lines
Designed and built a clickable quality console for a glass container maker near Pune with 4 furnaces and 12 forming lines: cameras and edge models classify every bottle and jar at the cold end, uncertain images go to a person, rejects are traced to the mould cavity that made them, and every decision shows the rule behind it.
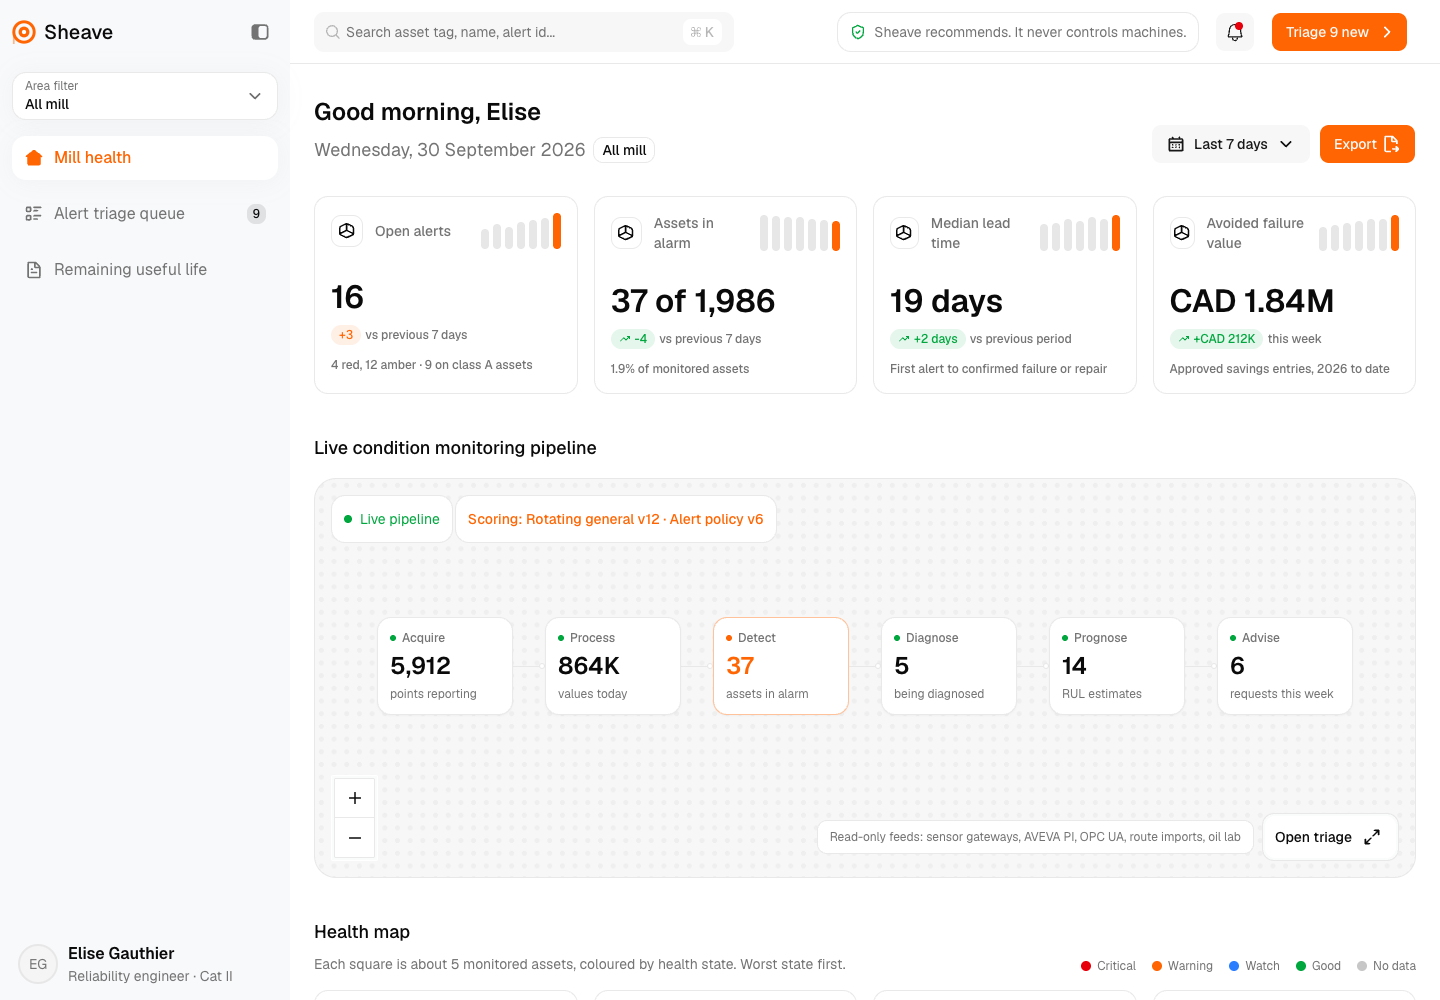
Sheave - Predictive Maintenance Platform for a Pulp and Paper Mill
Designed and built a clickable predictive maintenance console for an integrated pulp and paper mill in Ontario: anomaly scores that explain which signals moved, an alert queue sorted by consequence, remaining useful life shown as a band against planned shutdowns, and work requests sent to the CMMS - advisory only, never controlling a machine.
Enterprise Software Engineering - Human + AI
Contact Us
© 2026 - Copyright. All Rights reserved Oceanlab
Location
Global Headquarters
21 Merchant Road, 3rd Floor, Singapore 058267
Main corporate office and leadership operations
North America Office
548 Market Street, PMB 12345, San Francisco, CA 94104
Client operations and business development
India Office
402 Shivalik Shilp II, SG Highway, Ahmedabad 380015
Engineering and delivery center

Enterprise Software Engineering - Human + AI
Contact Us
Locations
Global Headquarters
21 Merchant Road, 3rd Floor, Singapore 058267
Main corporate office and leadership operations
North America Office
548 Market Street, PMB 12345, San Francisco, CA 94104
Client operations and business development
India Office
402 Shivalik Shilp II, SG Highway, Ahmedabad 380015
Engineering and delivery center
© 2026 - Copyright. All Rights reserved Oceanlab