Sukat - Data Quality Monitoring with Incidents and Circuit Breakers for a Hospital Group
Data Observability for a Malaysian Private Hospital Group
Designed and built a clickable data quality and observability tool for a private hospital group with five hospitals in the Klang Valley and Penang: table monitors on the analytics warehouse, incidents with owners and response targets, downstream impact on dashboards, and circuit breakers that hold publishing when a critical check fails.
Most of our work is under NDA. Per agreement, we can share the work but not the company details - all names and identifying information shown here have been changed.
Impact
Dashboard, monitors, monitor detail, incident queue and incident detail. Every one of the 26 demo monitors and 14 incidents opens its own detail page.
Acknowledge and resolve targets per severity: SEV1 15 min and 4 h, SEV2 60 min and 12 h, SEV3 4 h and 48 h. Countdowns turn amber in the last 25% and red when breached.
Monitors compute row counts, null rates, distinct counts and histograms inside the warehouse. The demo data is metadata and aggregates only, and the design shows sample rows only on a DPO-approved, masked and logged request.
26 monitors across 5 types on 17 warehouse tables and models, 14 incidents, 8 data products, 8 dashboards, 3 circuit breakers, 5 hospitals and 11 staff users.
The Problem
Bayu Merbau's analytics team of 14 feeds bed occupancy, theatre utilisation, length of stay, revenue cycle and clinical quality dashboards, plus the extracts used for Ministry of Health returns. When the Penang lab feed stalled for two days, the turnaround dashboard showed a false improvement that reached a board meeting. A vendor upgrade filled a diagnosis field with nulls and dropped a ward from the readmission report for a week. Problems surfaced when users complained, and analysts debugged by copying patient rows into spreadsheets.
Our Solution
Sukat watches the group's analytics warehouse, not the clinical systems. Table monitors and rule checks turn failures into incidents with owners and response targets, lineage shows which models and dashboards a failure reaches, and circuit breakers pause downstream refreshes and extracts until the data is fixed. Monitors run on aggregates, so patient data stays in the warehouse.
The Challenge: Catching Bad Health Data Before It Is Published
The warehouse loads nightly and hourly from each hospital's HIS, lab, radiology, pharmacy and billing systems. A stalled feed or a renamed column looks like real change on a dashboard, and the data behind it is sensitive personal data under Malaysian law.
Silent Failures Look Like Results
A feed that stops does not raise an error on a dashboard: lab turnaround simply looks faster and readmissions look lower. The team needed freshness, volume, schema change, null rate and drift checks per hospital, because one Penang feed can fail while the Klang Valley passes.
No View of What a Broken Table Feeds
Nobody could say which models, data products and Power BI or Tableau dashboards a failing table reached, or whether a bad load had already been published to hospital directors, the group board or a Ministry extract.
Health Data in the Debugging Loop
Health information is sensitive personal data under the PDPA 2010, and the 2024 amendments added a data protection officer and breach notification duties. Copying patient rows to debug a load was exactly what the DPO objected to, so the tool itself had to work without them.
Clinical Code Sets That Change
Feeds carry WHO ICD-10, ICD-11, SNOMED CT and LOINC codes, and the Ministry of Health moved its own reporting to ICD-11 from 2024. Checks have to test format and membership in a loaded code set version per feed, without ever judging whether a code is clinically right.
Our Approach: From Data Rules to a Clickable Monitoring Tool
Spec and Rules Research
Mapped 9 user roles from data engineer and on-call engineer to the DPO and data consumers, 34 screens across the staff app, a status portal and a mobile on-call page, and the data model for assets, monitors, runs, rule checks, code set versions, incidents, breakers, sample requests and audit. Wrote down the rules the design follows: PDPA 2010 and its 2024 amendments, the Private Healthcare Facilities and Services Act 1998, MyHDW reporting, code set formats and response targets as client policy.
Clickable Demo on a Production UI Kit
Built 5 key screens on a production dashboard kit: the dashboard with KPIs, a data product health grid and source feeds by hospital, the monitor list with status counts and bulk mute, pause and severity changes, monitor detail with the metric chart, thresholds, segments, runs and alerting, the incident queue with countdowns and grouping, and incident detail with what failed, impact, held jobs, consumer updates and the resolve flow. All actions run on local state.
What a Production Build Adds
Monitors running as SQL in Snowflake, dbt manifests and run results, Airflow to pause and resume held tasks, OpenLineage events, Power BI and Tableau metadata for impact, Slack and Teams alerts, PagerDuty paging, Jira follow-ups, Entra ID sign-in and Amazon SES for consumer emails. Plus the remaining screens (assets, rules and code sets, lineage, data products, breakers, privacy and audit, reports, settings, status portal and mobile on-call), a validated anomaly model and a full audit log.
Why It Works: Hold the Data, Not the People
Health at a Glance, Per Hospital
Each data product tile takes the colour of its worst open incident and shows its last refresh against its target. The source feed grid has a cell per hospital and system, amber past its freshness target and red past twice the target.
Related Failures Become One Incident
Failures on the same asset within 30 minutes join one incident, so the George Town lab outage shows as one SEV1 with 3 monitors grouped instead of three pages. Changing severity or marking a run as expected needs a reason.
Circuit Breakers Stop Bad Data Spreading
A failing critical check trips a breaker that holds the dbt model and Power BI refreshes it feeds, so dashboards keep the last good data rather than a false trend. Release needs an owner or the analytics lead, and an override needs a second approver.
Privacy Built Into the Workflow
An incident flagged as possible personal data goes to the DPO and cannot be resolved without DPO sign-off. Sukat never decides whether something is a breach: it routes the case and keeps the evidence, and every change records who, when, and the before and after values.
Related case studies
View all: Data & analytics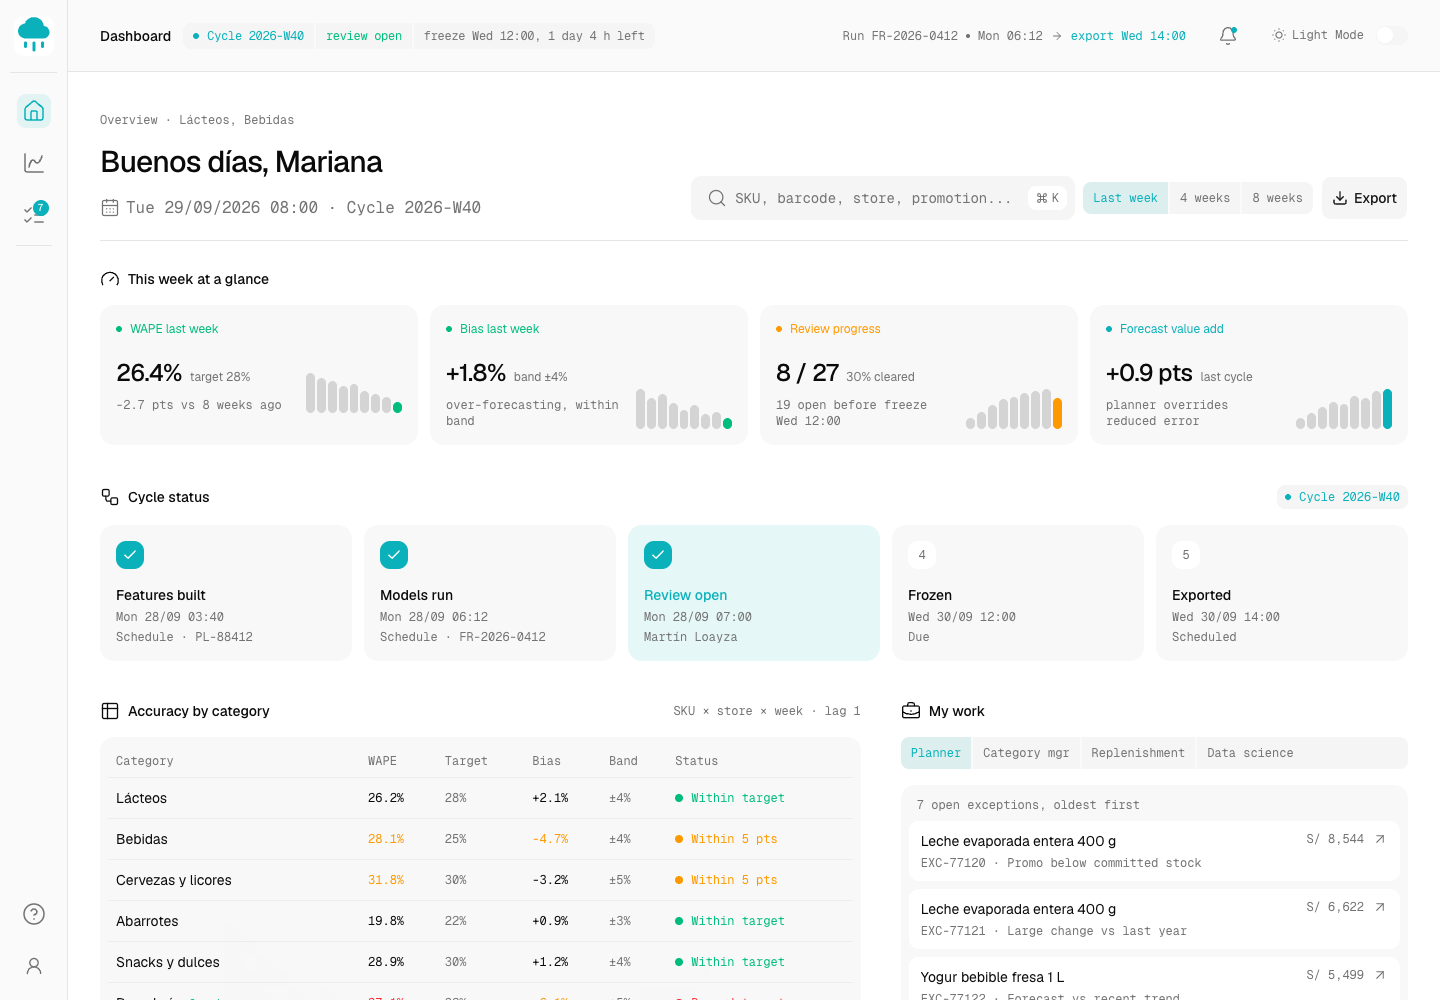
Garúa - Explainable Demand Forecasting for Grocery Planners
Designed and built a clickable demand forecasting platform for a Lima supermarket chain: daily SKU by store forecasts with an 80% band, a driver breakdown for every forecast, a weekly review where planners override with a reason inside approval limits, and a freeze before the export to replenishment.
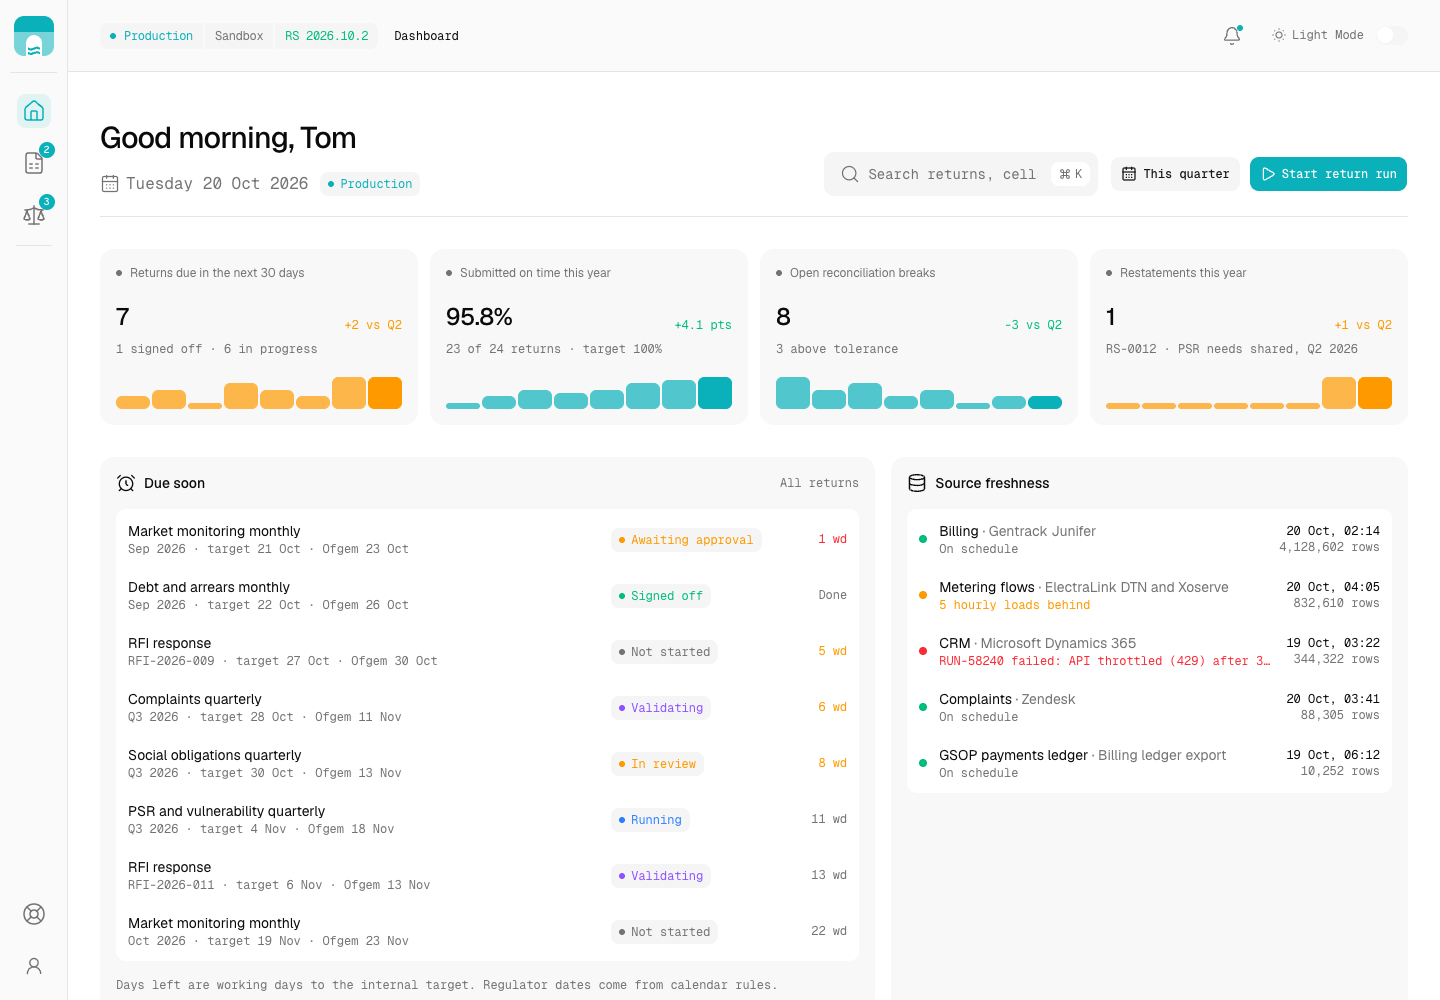
Culvert - Compliance Reporting Pipeline from Source Extract to Signed-Off Ofgem Return
Designed and built a clickable regulatory reporting pipeline for a Great Britain electricity and gas supplier: pinned source extracts, versioned transformation rules, reconciliations between systems, validation of every filled return and maker-checker sign-off, with every figure traceable back to the rows that produced it.
Enterprise Software Engineering - Human + AI
Contact Us
© 2026 - Copyright. All Rights reserved Oceanlab
Location
Global Headquarters
21 Merchant Road, 3rd Floor, Singapore 058267
Main corporate office and leadership operations
North America Office
548 Market Street, PMB 12345, San Francisco, CA 94104
Client operations and business development
India Office
402 Shivalik Shilp II, SG Highway, Ahmedabad 380015
Engineering and delivery center

Enterprise Software Engineering - Human + AI
Contact Us
Locations
Global Headquarters
21 Merchant Road, 3rd Floor, Singapore 058267
Main corporate office and leadership operations
North America Office
548 Market Street, PMB 12345, San Francisco, CA 94104
Client operations and business development
India Office
402 Shivalik Shilp II, SG Highway, Ahmedabad 380015
Engineering and delivery center
© 2026 - Copyright. All Rights reserved Oceanlab