Garúa - Explainable Demand Forecasting for Grocery Planners
ML Demand Forecasting for a Peruvian Supermarket Chain
Designed and built a clickable demand forecasting platform for a Lima supermarket chain: daily SKU by store forecasts with an 80% band, a driver breakdown for every forecast, a weekly review where planners override with a reason inside approval limits, and a freeze before the export to replenishment.
Most of our work is under NDA. Per agreement, we can share the work but not the company details - all names and identifying information shown here have been changed.
Impact
Dashboard, forecast explorer, forecast detail for one SKU at one store, review queue and the category review workspace with its editable 14-day store grid.
A planner's change above 30% or S/ 5,000 of value a week is flagged before it is saved and needs the category manager's approval. The limit is Huarango policy, set per user.
Large change vs last year, break from recent trend, new item, promotion below committed stock, zero forecast with stock, accuracy breach and model drift, each sized in units and soles.
22 SKUs at 17 stores, each with its own detail page, plus 11 categories with accuracy targets, 27 exceptions, 7 overrides, 5 models, 5 promotions and 8 calendar events.
The Problem
Huarango's 72 stores were replenished from a spreadsheet model per category: a 4-week moving average adjusted by hand. It could not see promotions, Fiestas Patrias, a regional holiday in Cusco or a hot week in Lima, so beer and bottled water ran out on the days that mattered while bread, fruit and dairy were thrown away on the days that did not. Planners spent Monday and Tuesday copying numbers between files, nobody knew whether their adjustments helped, and a better model built in a notebook had no way into daily use.
Our Solution
Garúa forecasts about 21,000 SKUs at every store, daily up to 42 days ahead and weekly up to 26 weeks. Planners review only the exceptions in their categories, see the drivers behind each number, override with a reason inside their approval limit and close the review before the Wednesday freeze, after which the forecast goes to the replenishment system.
The Challenge: Forecasts Planners Can Trust
Grocery demand in Peru moves with holidays, paydays, promotions and weather that differ by region, and a forecast is only useful if the planners who send it to replenishment can see why it says what it says.
A Calendar That Keeps Changing
Peru's public holidays have changed by law in recent years, extra non-working days can be declared at short notice by supreme decree, and some celebrations, such as Inti Raymi in Cusco, matter only in one region. The July and December gratificaciones and month-end and mid-month paydays move demand too.
Promotions With a Stock Commitment
Under the Consumer Protection and Defence Code (Ley 29571), an advertised limited-stock promotion generally has to state the minimum quantity available. A forecast below that committed stock is a problem buyers need to see before the promotion launches.
Overrides Nobody Measured
Planners adjusted forecasts by hand with no reason recorded and no limit on size, so there was no way to tell which changes reduced error and which added to it, or who should approve a large one.
Models Without Governance
A model has to be trained, backtested and compared live before it replaces the one in use, with a named approver, and it has to work from sales aggregated to SKU, store and day so that no customer personal data under Ley 29733 is needed.
Our Approach: From Forecasting Rules to a Clickable Review
Spec and Rules Research
Mapped 11 roles from demand planner and category manager to data scientist, ML engineer and store manager, 36 screens (34 staff and 2 store portal), and the data model for SKUs, stores, sales, prices, promotions, calendar events, weather, models, backtests, forecast runs, exceptions, overrides and exports. Wrote down the rules the design follows: Ley 29733 and its 2024 regulation, Ley 29571 on promotions, shelf prices including IGV, SENAMHI weather with a fallback feed, El Niño costero alerts, holidays kept as editable data and champion and challenger model governance.
Clickable Demo on a Production UI Kit
Built 5 key screens on a production dashboard kit: the dashboard with WAPE, bias, review progress and forecast value add over 9 weeks, the cycle step bar and accuracy by category; the forecast explorer from chain to store, by day or week, in units or soles net of IGV, with CSV export; forecast detail with 42-day and 52-week charts, the driver waterfall and model vs final accuracy; the review queue with bulk accept and approvals; and the review workspace with frozen days locked. Changes run on local state.
What a Production Build Adds
Connections to the warehouse (Snowflake or BigQuery), SAP S/4HANA, the replenishment system (RELEX or Blue Yonder), SENAMHI with Open-Meteo or Meteomatics, model training and tracking on Databricks with MLflow or SageMaker, Airflow or Dagster pipelines, a Feast feature store and SHAP explanations. Microsoft Entra ID sign-on by role, an append-only audit log, and the remaining screens: promotions, new products, fresh, export runs, model registry, backtests, champion and challenger, drift monitoring, pipelines, calendar, weather, accuracy, settings and the store portal.
Why It Works: Every Number Has a Reason
Each Forecast Explains Itself
A driver waterfall shows how the forecast for a chosen day is built, for example baseline 81, weekday pattern -4, second unit at 50% +40, month-end payday +7 and price vs competitors -4, making 121. Promotions, holidays and stockout days are marked on every chart.
Planners Work Exceptions, Not Every Row
The review queue lists only the exceptions raised this cycle, grouped by category with their size in units and soles, so a planner starts with the biggest issues, such as a limited-stock promotion forecast at 45,600 units against 48,000 committed.
Overrides Carry a Reason and a Result
Every override needs a reason from Huarango's list, and the rules check shows the change against the planner's limit before saving. Forecast detail compares model and final accuracy over 8 and 26 weeks, and each past override is marked as helped, hurt or neutral.
One Cycle, One Freeze
The cycle banner counts down to the Wednesday 12:00 freeze, the step bar shows when features, models and review finished and who closed them, the first 3 days in the store grid are locked, and a category review closes only when nothing is open or awaiting approval.
Related case studies
View all: Data & analytics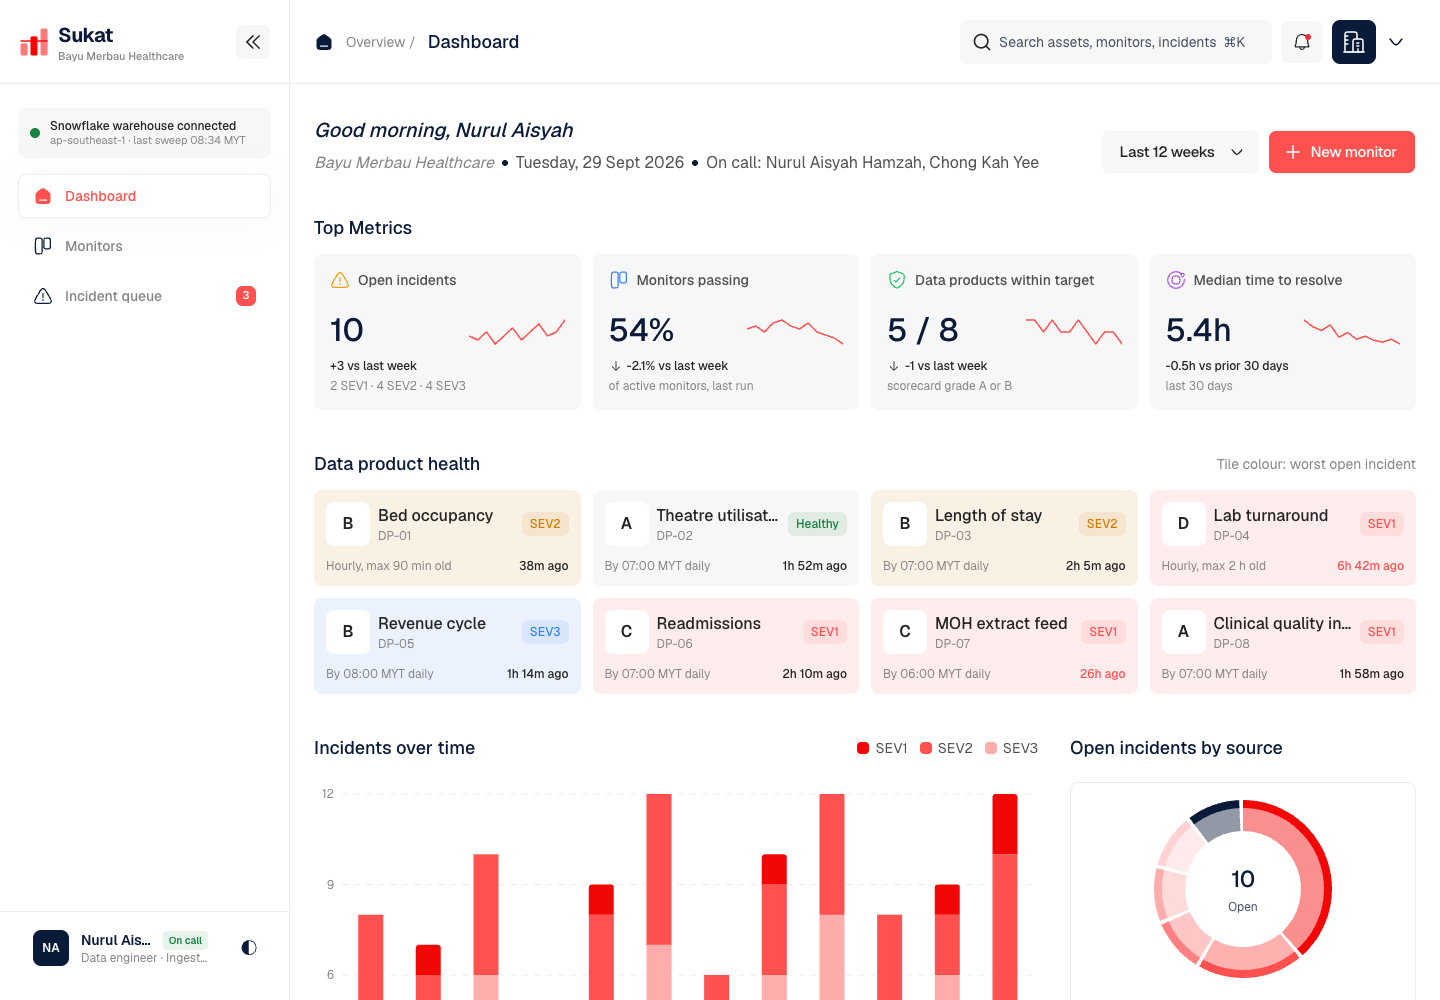
Sukat - Data Quality Monitoring with Incidents and Circuit Breakers for a Hospital Group
Designed and built a clickable data quality and observability tool for a private hospital group with five hospitals in the Klang Valley and Penang: table monitors on the analytics warehouse, incidents with owners and response targets, downstream impact on dashboards, and circuit breakers that hold publishing when a critical check fails.
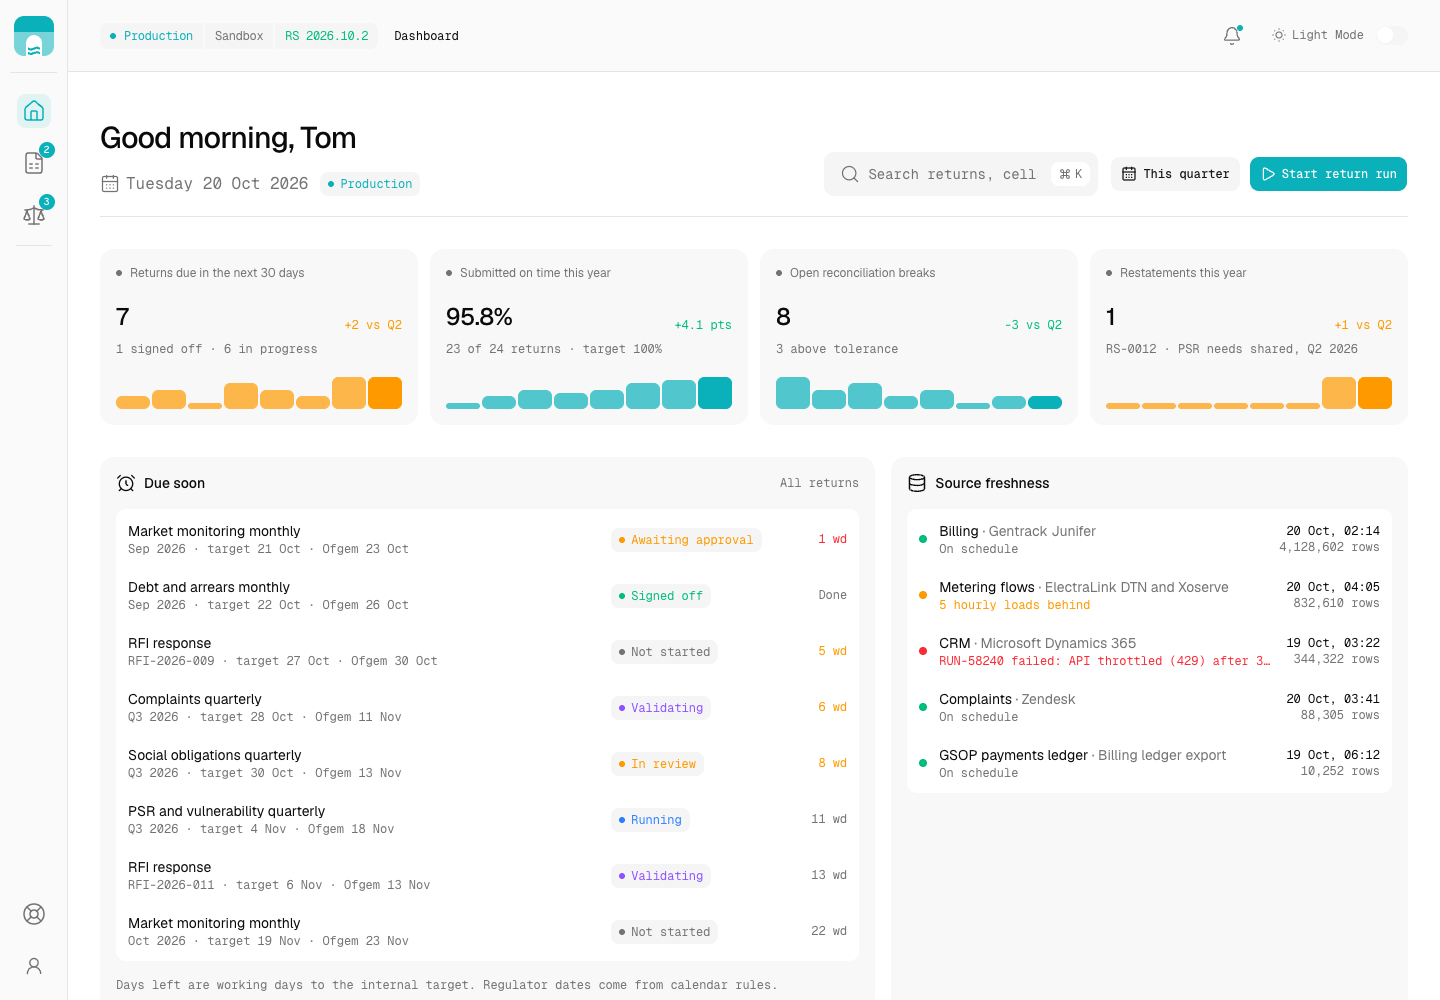
Culvert - Compliance Reporting Pipeline from Source Extract to Signed-Off Ofgem Return
Designed and built a clickable regulatory reporting pipeline for a Great Britain electricity and gas supplier: pinned source extracts, versioned transformation rules, reconciliations between systems, validation of every filled return and maker-checker sign-off, with every figure traceable back to the rows that produced it.
Enterprise Software Engineering - Human + AI
Contact Us
© 2026 - Copyright. All Rights reserved Oceanlab
Location
Global Headquarters
21 Merchant Road, 3rd Floor, Singapore 058267
Main corporate office and leadership operations
North America Office
548 Market Street, PMB 12345, San Francisco, CA 94104
Client operations and business development
India Office
402 Shivalik Shilp II, SG Highway, Ahmedabad 380015
Engineering and delivery center

Enterprise Software Engineering - Human + AI
Contact Us
Locations
Global Headquarters
21 Merchant Road, 3rd Floor, Singapore 058267
Main corporate office and leadership operations
North America Office
548 Market Street, PMB 12345, San Francisco, CA 94104
Client operations and business development
India Office
402 Shivalik Shilp II, SG Highway, Ahmedabad 380015
Engineering and delivery center
© 2026 - Copyright. All Rights reserved Oceanlab