Stoep - Impact Measurement and Reporting Platform for a Youth Employment Nonprofit
Impact Dashboard for a South African Youth Employment NPO
Designed and built a clickable impact dashboard for a South African youth employment nonprofit: one versioned definition for every indicator, results against target with the people behind each number, disaggregation that hides small groups automatically, and a board view that shows only signed-off, frozen figures.
Most of our work is under NDA. Per agreement, we can share the work but not the company details - all names and identifying information shown here have been changed.
Impact
Dashboard, indicator library with quick view, indicator detail with 5 tabs, disaggregation and the board dashboard. Every indicator in the library opens its own detail page.
Staff see every cell, the board sees groups of 5 or more and donors and the public groups of 10 or more, with a second cell hidden when the first could be worked out by subtraction.
Gender, age band, disability by the Washington Group Short Set, population group, province, site and home language, each with the share of participants it was recorded for.
Output, outcome and impact indicators with 8 quarters of results, 3 programmes, 5 sites, 7 data sources, 4 donor views and 11 staff users.
The Problem
Jacaranda Ridge collected a lot of data and could prove very little with it. Attendance lived in the programme system, follow-up surveys in three KoboToolbox projects and placements in a spreadsheet typed up from coordinators' phone calls. The M&E officer spent about three weeks every quarter reconciling them, last year's annual report used two definitions of "in work at six months", a corporate donor waited a month for beneficiary evidence, and nothing stopped a report from showing one participant with a disability at one site.
Our Solution
Stoep takes the organisation from what it believes changes to the evidence. Every number comes from one versioned indicator definition, results show their target, status and the people behind them, disaggregation applies the right disclosure threshold for staff, board, donors and the public, and the board sees only quarters that the M&E manager has signed off.
The Challenge: Proving Impact Without Exposing People
A youth employment nonprofit reports the same outcomes to its board, a dozen donors and the public. Each wants a different cut, and much of the data that shows who benefits is special personal information under POPIA.
One Outcome, Several Definitions
"In work at six months" and "women placed" meant different things on different pages of the same annual report. Without one agreed definition with a numerator, denominator and exclusions, every donor report became a fresh calculation.
Data Scattered Across Systems
Enrolments and attendance came from the programme system, follow-ups from three survey projects and placements from a spreadsheet. The board could not see whether outcomes were improving, because nobody could reconcile the sources in time.
Special Personal Information
Disability counts as health information and population group as race under POPIA, so both need separate, specific consent. Corporate donors ask for the share of black beneficiaries for their B-BBEE socio-economic development file, and a single yes/no disability question found almost nobody.
Small Numbers That Identify People
A split by disability and site can leave a cell of one or two people. Jacaranda Ridge's own policy hides donor and public figures based on fewer than 10 people and board figures based on fewer than 5, including any second cell that would give the first away.
Our Approach: From Theory of Change to a Clickable Dashboard
Spec and Rules Research
Mapped 12 user types across staff, board, donor portal, participant links and the public report, 39 screens and the data model for theories of change, versioned indicators, targets, data sources, imports, participants, consents, surveys, results and disclosure rules. Wrote down the rules the design follows: POPIA and special personal information, the Nonprofit Organisations Act, PBO status, B-BBEE socio-economic development evidence, SDG alignment and the Washington Group Short Set.
Clickable Demo on a Production UI Kit
Built 5 key screens on a production dashboard kit: the dashboard with KPIs, outcome funnel, indicators against target, data readiness and My work by role; the indicator library with filters and quick view; indicator detail with definition, version history, targets, results, data points and SDG alignment; disaggregation with the suppression matrix, gap chart and coverage; and the board dashboard. A period switcher drives every page and all actions run on local state.
What a Production Build Adds
Integration with KoboToolbox, SurveyCTO or ODK Central, Salesforce Nonprofit Cloud or CommCare, Clickatell SMS, WhatsApp through Turn.io or Twilio, and Postmark email, hosted in a South African cloud region. Staff SSO with Microsoft Entra ID or Google Workspace, an audit log with before and after values, and the remaining screens: theory of change builder, imports, data quality, participants, surveys, consent register, donor views, board packs, the donor portal, the public impact report and participant survey links.
Why It Works: Every Number Explains Itself
One Versioned Definition per Number
Each indicator has a plain-language definition, numerator, denominator, inclusions and exclusions. Editing it creates a new version with a required change note, so the history shows why "in work at six months" changed and when.
Small Groups Hidden Automatically
The disaggregation matrix applies the board threshold by default, and Preview as donor or public switches to the threshold of 10. Hidden cells show a lock and say whether they were too small or hidden so another could not be worked out.
Honest About What Numbers Rest On
Rates show the people behind them, such as 181 of 312 graduates reached, with data completeness and attribute coverage. SDG tags are marked direct or contributing, with a note that alignment is not South Africa's national SDG progress.
Sign-Off Before the Board Sees It
The dashboard shows data readiness per source and blocks sign-off while key indicators have critical issues. The board sees only the latest signed-off quarter, with frozen figures, a plain-English line per tile and the theory of change coloured by status.
Related case studies
View all: Nonprofit & NGO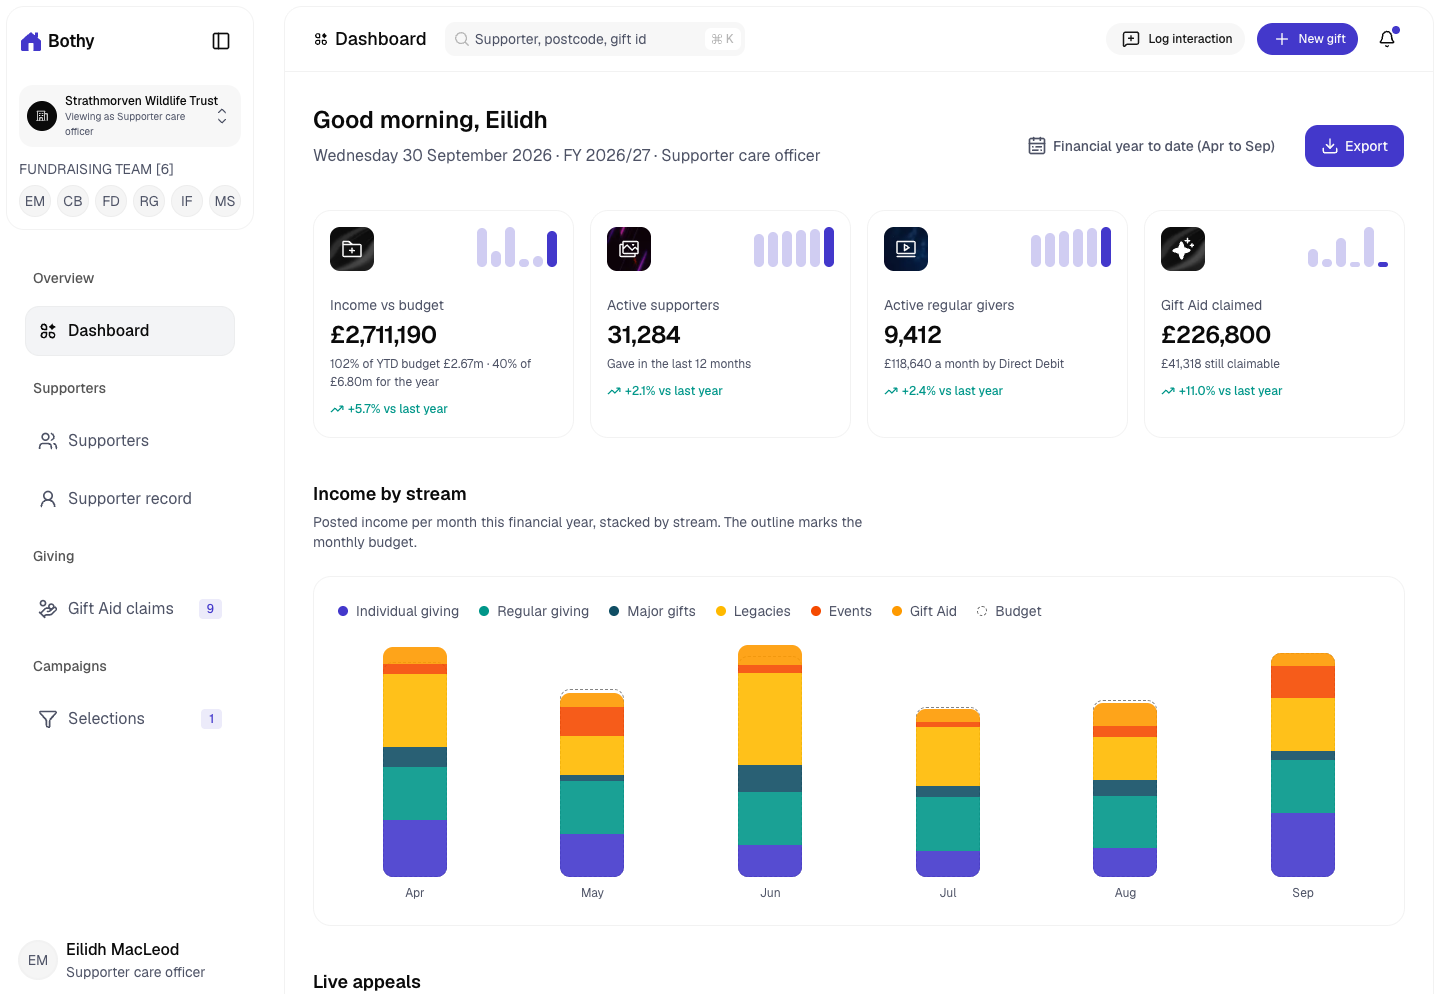
Bothy - Donor CRM with Consent, Gift Aid and Suppressions Built In
Designed and built a clickable donor CRM for a Perth-based wildlife charity registered with OSCR: supporter records that show what each person agreed to and how, Gift Aid claims that hold back gifts with a problem, and mailing selections that remove every suppression before a file goes out.
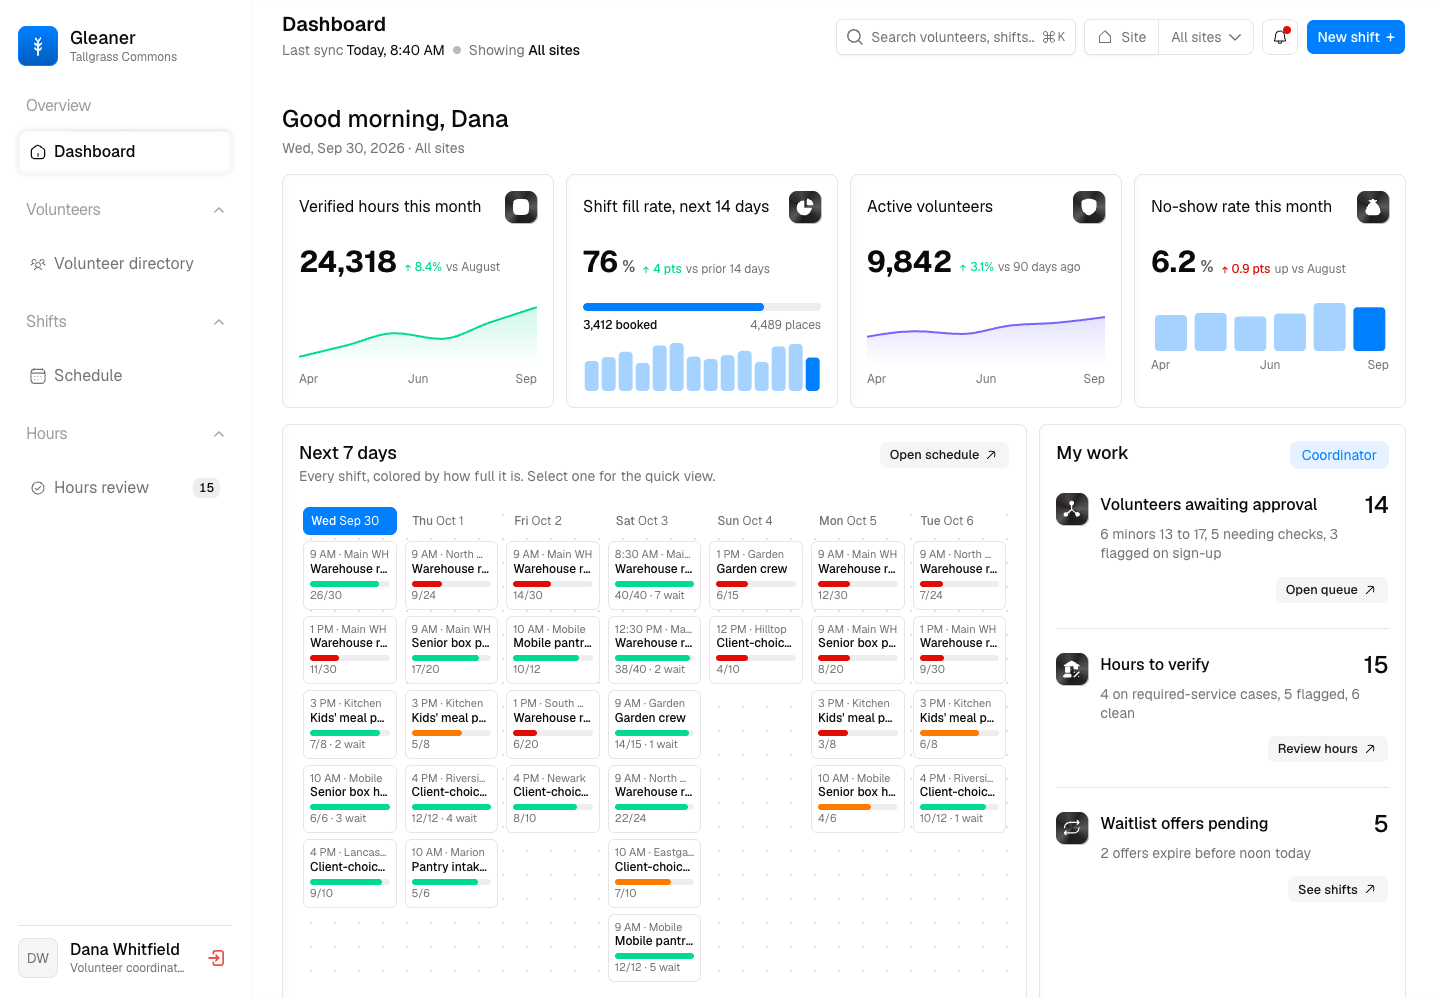
Gleaner - Volunteer Management Platform with Verified Hours and Screening Built In
Designed and built a clickable volunteer management platform for a regional food bank network in Ohio: shifts colored by how full they are, a volunteer directory and profile with readiness, screening and consent in one place, and an hours review queue that flags anything a person should check before it counts.
Enterprise Software Engineering - Human + AI
Contact Us
© 2026 - Copyright. All Rights reserved Oceanlab
Location
Global Headquarters
21 Merchant Road, 3rd Floor, Singapore 058267
Main corporate office and leadership operations
North America Office
548 Market Street, PMB 12345, San Francisco, CA 94104
Client operations and business development
India Office
402 Shivalik Shilp II, SG Highway, Ahmedabad 380015
Engineering and delivery center

Enterprise Software Engineering - Human + AI
Contact Us
Locations
Global Headquarters
21 Merchant Road, 3rd Floor, Singapore 058267
Main corporate office and leadership operations
North America Office
548 Market Street, PMB 12345, San Francisco, CA 94104
Client operations and business development
India Office
402 Shivalik Shilp II, SG Highway, Ahmedabad 380015
Engineering and delivery center
© 2026 - Copyright. All Rights reserved Oceanlab