Nhịp - Real-Time Game Analytics Platform with Consent Built In
Live Event Analytics for a Vietnamese Mobile Game Studio
Designed and built a clickable real-time analytics platform for a Ho Chi Minh City studio with three free-to-play mobile games: live player, revenue and crash numbers within seconds, a validated event stream for QA, anomaly alerts with an expected band, and deletion and access requests tracked across every system that holds player data.
Most of our work is under NDA. Per agreement, we can share the work but not the company details - all names and identifying information shown here have been changed.
Impact
Live overview, live event stream, alerts, incident detail and deletion and access requests. Each of the 12 incidents opens its own detail page.
Concurrent players, DAU so far, revenue per minute, purchases in the last hour, crash rate and events per second, each with a sparkline and a comparison to the same time last week.
Raw events, aggregates, segments, the attribution partner, the crash reporter, the warehouse copy and the game backend, each marked done, pending or not held, due 14 days after verification.
3 games, 18 deletion, access and consent requests (from GDPR and UK GDPR to the Vietnam PDPL and US state law), 11 alert rules, 12 incidents, 10 staff users and 15 countries.
The Problem
Mưa Rào's numbers arrived a day late. Gameplay events went to a free analytics tool with a 24-hour delay, while ad revenue, store revenue and crashes each sat in a different dashboard. When a Friday live event broke the level 40 boss fight in Đảo Mèo, the team learned about it from one-star reviews on Sunday. Event names drifted between client versions, A/B tests were read off spreadsheets, and when an EU player asked for deletion nobody could say which systems still held their data.
Our Solution
Nhịp collects events from the studio's own SDK, checks each one against a versioned schema and turns the stream into live numbers within seconds. Live-ops staff watch players, revenue and crashes as they happen, QA watches test devices in the live stream, anomaly alerts open incidents with their likely cause, and the privacy team tracks every deletion and access request system by system.
The Challenge: Live Numbers, Only With Consent
A free-to-play studio lives on knowing what players do right now, but it publishes worldwide from Vietnam, so every event has to respect Vietnamese law, GDPR, Apple's and Google's store rules and the rules for younger players at once.
A Day Behind the Players
With a 24-hour processing delay and four separate dashboards for gameplay, ads, store revenue and crashes, a broken live event surfaced in reviews before it surfaced in the data. Live-ops needed one view that updates in seconds.
Event Names That Drift
The same action arrived as lvl_complete, level_completed or LevelComplete depending on the client version, so every funnel needed hand cleaning. Events have to be checked against a schema at the door, with rejects visible to the people who send them.
Consent Before the First Event
The ePrivacy rules and GDPR, the Vietnam PDPL and Apple App Tracking Transparency all limit what an analytics SDK may send. Nothing may be tracked before a player answers the consent prompt, iOS events go to the attribution partner only with ATT permission, and younger players get no advertising identifiers.
Deletion Across Many Systems
A player's data sits in raw events, aggregates, segments, the attribution partner, the crash reporter, the warehouse and the game backend. GDPR requests generally need an answer within one month, and the studio had no way to prove each system had been cleared.
Our Approach: From Privacy Rules to a Live Console
Spec and Rules Research
Mapped 10 roles from live-ops manager and data engineer to privacy officer and the player, 35 screens (31 staff and 4 player-facing) and the data model for events, schema versions, consent records, experiments, segments, alert rules, incidents, privacy requests and retention policies. Wrote down the rules the design follows: the Vietnam PDPL and its implementing decree, GDPR and ePrivacy, Apple ATT, Google Play's User Data policy, COPPA, the UK Children's Code, Decree 147/2024/ND-CP on online games and store rules on loot box odds.
Clickable Demo on a Production UI Kit
Built 5 key screens on a production dashboard kit: the live overview with KPI tiles, concurrent players against last week with release and live event markers, revenue by source with refunds below the axis and crash rate by app version; the live event stream with rejected events, an event detail panel and a test device session; alerts with incidents and rules; incident detail with the expected band and an automatic breakdown; and deletion and access requests with the systems checklist. All actions run on local state.
What a Production Build Adds
Event transport on managed Kafka, stream processing in Apache Flink, a real-time store such as ClickHouse or Apache Pinot, Confluent Schema Registry, consent through Google UMP or Usercentrics, the App Store Server API and Google Play Developer API, AppLovin MAX, Crashlytics, AppsFlyer, PagerDuty, Slack and Zalo OA, and a nightly copy to BigQuery or Snowflake. Google Workspace sign-in with two-factor and roles, a full access log, and the remaining screens: dashboards, event explorer, funnels, retention, experiments, segments, schema registry, consent and ATT reporting, drop-rate audit, settings, the in-game consent prompt and the player privacy centre.
Why It Works: Live, Explained and Accountable
Freshness Always on Screen
The top bar shows the pipeline lag on every page (Live · 4s behind), turning amber past 60 seconds and red past 5 minutes, so nobody reads a stale chart as live. A Production or Staging chip keeps test data out of production charts.
Alerts Come With Their Cause
Each incident shows the observed value against its expected band, with releases and live events marked on the chart, and an automatic breakdown such as 86% of extra crashes coming from Android 2.14.0. Owners acknowledge, escalate to PagerDuty or resolve with a cause.
Bad Events Caught at the Door
The live stream highlights rejected events with the reason, such as a missing required field or an unknown event name. A test device session shows only one device's events against the checklist of events the build is expected to send.
Privacy Carried on Every Event
Each event shows its analytics, advertising and ATT consent and whether it may go to attribution. Deletion and access requests show in-game code verification, a checklist per system and days left, and every step is written to the access log.
Related case studies
View all: Data & analytics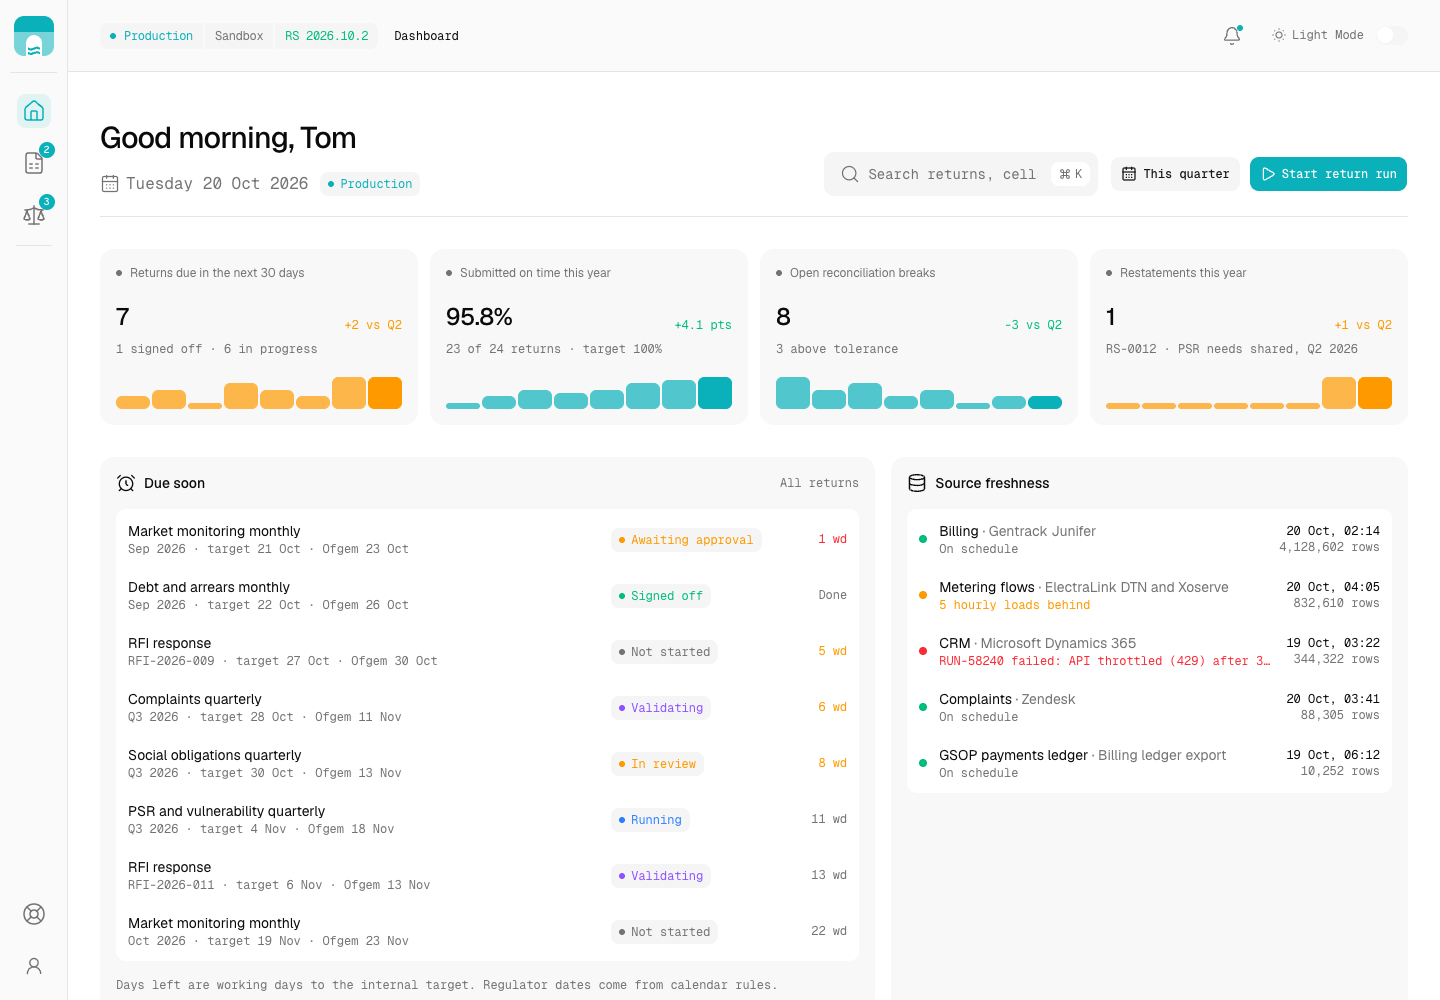
Culvert - Compliance Reporting Pipeline from Source Extract to Signed-Off Ofgem Return
Designed and built a clickable regulatory reporting pipeline for a Great Britain electricity and gas supplier: pinned source extracts, versioned transformation rules, reconciliations between systems, validation of every filled return and maker-checker sign-off, with every figure traceable back to the rows that produced it.
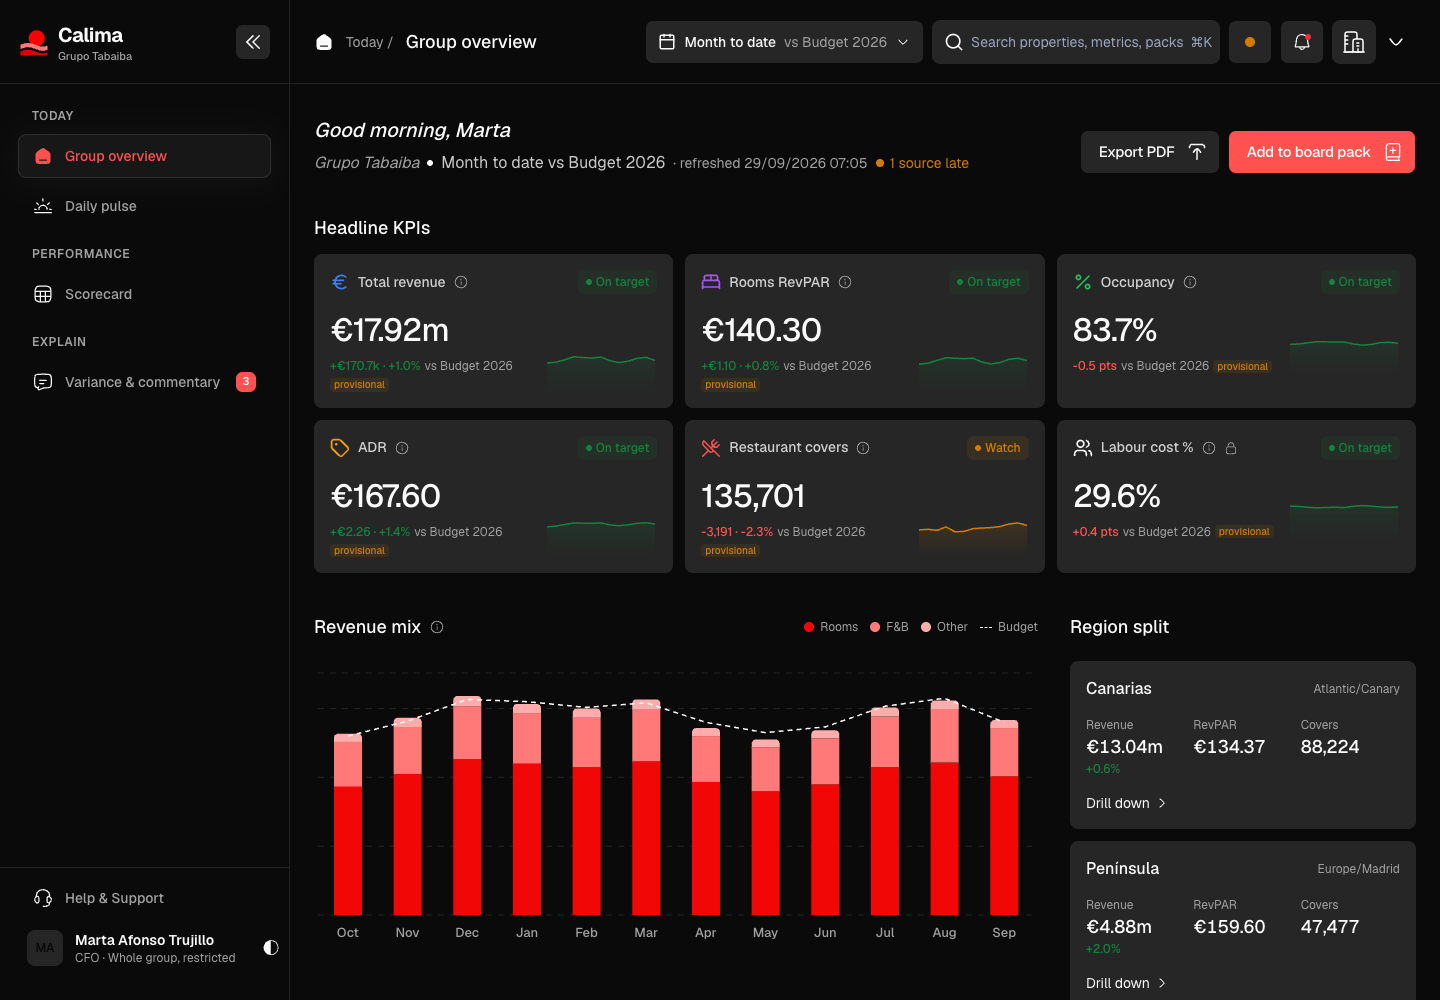
Calima - Executive BI Dashboards with One Governed Set of Hotel and Restaurant KPIs
Designed and built a clickable executive dashboard portal for a Canary Islands hotel and restaurant group: one governed definition of RevPAR, ADR, occupancy, covers, food cost and labour cost, a daily pulse per region, a property scorecard against targets, drill-down to each hotel and restaurant, and variance commentary before the numbers reach the board.
Enterprise Software Engineering - Human + AI
Contact Us
© 2026 - Copyright. All Rights reserved Oceanlab
Location
Global Headquarters
21 Merchant Road, 3rd Floor, Singapore 058267
Main corporate office and leadership operations
North America Office
548 Market Street, PMB 12345, San Francisco, CA 94104
Client operations and business development
India Office
402 Shivalik Shilp II, SG Highway, Ahmedabad 380015
Engineering and delivery center

Enterprise Software Engineering - Human + AI
Contact Us
Locations
Global Headquarters
21 Merchant Road, 3rd Floor, Singapore 058267
Main corporate office and leadership operations
North America Office
548 Market Street, PMB 12345, San Francisco, CA 94104
Client operations and business development
India Office
402 Shivalik Shilp II, SG Highway, Ahmedabad 380015
Engineering and delivery center
© 2026 - Copyright. All Rights reserved Oceanlab