Calima - Executive BI Dashboards with One Governed Set of Hotel and Restaurant KPIs
Executive Dashboard Portal for a Spanish Hospitality Group
Designed and built a clickable executive dashboard portal for a Canary Islands hotel and restaurant group: one governed definition of RevPAR, ADR, occupancy, covers, food cost and labour cost, a daily pulse per region, a property scorecard against targets, drill-down to each hotel and restaurant, and variance commentary before the numbers reach the board.
Most of our work is under NDA. Per agreement, we can share the work but not the company details - all names and identifying information shown here have been changed.
Impact
Group overview, daily pulse, scorecard, property detail with 7 tabs and variance and commentary. Every one of the 26 demo properties opens its own detail page.
Each with its formula, version, sensitivity and green and amber tolerance bands, from RevPAR and ADR on STR definitions to GOP margin on the client's USALI 12th edition mapping.
A variance to budget needs an explanation when it breaches both limits. Commentary moves from required to requested, drafted, submitted and approved, or is sent back or marked not required with a reason.
14 hotels across two brands and 12 Sal y Lava restaurants in the Canary Islands and on the mainland, with 18 commentary items, 10 alerts and 10 events such as a 60-room renovation.
The Problem
Every Monday, Grupo Tabaiba's finance team assembled a 40-tab spreadsheet from two property management systems, three restaurant point-of-sale systems, payroll and accounting. Brands counted occupancy differently, food cost was reported before or after staff meals depending on who filled in the sheet, and group occupancy was an average of property percentages. The board pack took four working days, and the executive committee spent half of each meeting arguing about whose number was right.
Our Solution
Calima gives the executive committee, brand and regional directors and general managers the same numbers, defined once in a metric catalogue and recomputed from summed rooms, revenue and covers at every level. Directors see yesterday per region in a daily pulse, every property against its targets in one scorecard, and each material variance with an owner, a due date and an approved explanation.
The Challenge: One Number Everyone Agrees On
Grupo Tabaiba runs resort hotels in the Canary Islands, urban hotels on the mainland and restaurants in both, on different systems and in two time zones. The same KPI meant something different in each brand, and nobody could say which version reached the board.
Ratios That Do Not Add Up
Occupancy is rooms sold over rooms available, ADR is rooms revenue over rooms sold and RevPAR is rooms revenue over rooms available. Averaging property percentages gives the wrong group figure, and out-of-order and complimentary rooms have to be counted the way the benchmarking provider does.
Two Regions, Two Clocks, Two Taxes
The Canary Islands run one hour behind the mainland, so yesterday closes at a different time per property. Revenue must always be net of indirect tax, IGIC in the Canaries and IVA on the mainland, and never mix gross and net figures.
Restricted Figures Without Leaks
Labour, GOP and payroll were emailed as attachments with no record of who opened them. Under GDPR and the LOPDGDD, labour metrics for very small teams can reveal one person's pay, and logging who views financials is employee monitoring that staff must be told about.
Variances Nobody Owned
Large misses against budget reached the board without an explanation, or with one written after the meeting. Renovations, strikes and flight cuts that moved the numbers lived in email, so nobody could see later why a month looked the way it did.
Our Approach: From Metric Definitions to a Clickable Portal
Spec and Rules Research
Mapped 11 user roles from the executive committee to board members, 28 screens across the staff portal and a read-only board portal, and the data model for properties, outlets, versioned metrics, targets, tolerances, commentary, events, alerts, sources, board packs and an append-only audit. Wrote down the rules the design follows: STR rooms metric definitions, the USALI chart of accounts, IGIC and IVA, two time zones, GDPR and the LOPDGDD, and the registro de viajeros under RD 933/2021.
Clickable Demo on a Production UI Kit
Built 5 key screens on a production dashboard kit: the group overview with 6 headline KPIs, revenue mix and region split, the daily pulse with a business date strip per region and month-to-date pace, the scorecard with banded cells and brand subtotals, property detail with Rooms, Food & beverage, Labour and USALI P&L tabs, and variance and commentary with its thread panel. Scope, period and comparison pickers drive the figures, and commentary actions run on local state.
What a Production Build Adds
A connection to the group's data warehouse (such as Snowflake or BigQuery), fed from OPERA Cloud or Mews, Simphony or Lightspeed, the stock, payroll and accounting systems and STR benchmark files. Microsoft Entra ID sign-on with MFA, row-level security enforced in the API, the sensitive-view audit, alerts by email, push and Teams, and the remaining screens: metric explorer, benchmark, board pack editor, governance, settings and the board portal.
Why It Works: Defined Once, Trusted Everywhere
Totals Built From Components
Brand subtotals and the scope total are recomputed from summed rooms, revenue and covers, never averaged from property percentages, and the scorecard says so under the totals. Every metric label carries an i icon with its plain-words formula, version and standard reference.
Freshness on Every Page
A dot in the top bar turns amber when a source is late and names it, here a night audit not yet received from one La Palma hotel. The daily pulse shows which properties have not closed their business day and marks their figures provisional.
Restricted Means Visible and Logged
Labour cost %, GOP margin and the P&L carry a lock icon, and the design records every view of them in an append-only sensitive-view audit. Labour by department is suppressed for teams below the client's minimum headcount of 5, so no one's pay can be worked out.
Every Variance Has an Owner
The variance table lists actual, budget, variance, owner, due date and status, with overdue items in red. Events such as a renovation are linked to the commentary, and a property that is not like-for-like is flagged on its page.
Related case studies
View all: Data & analytics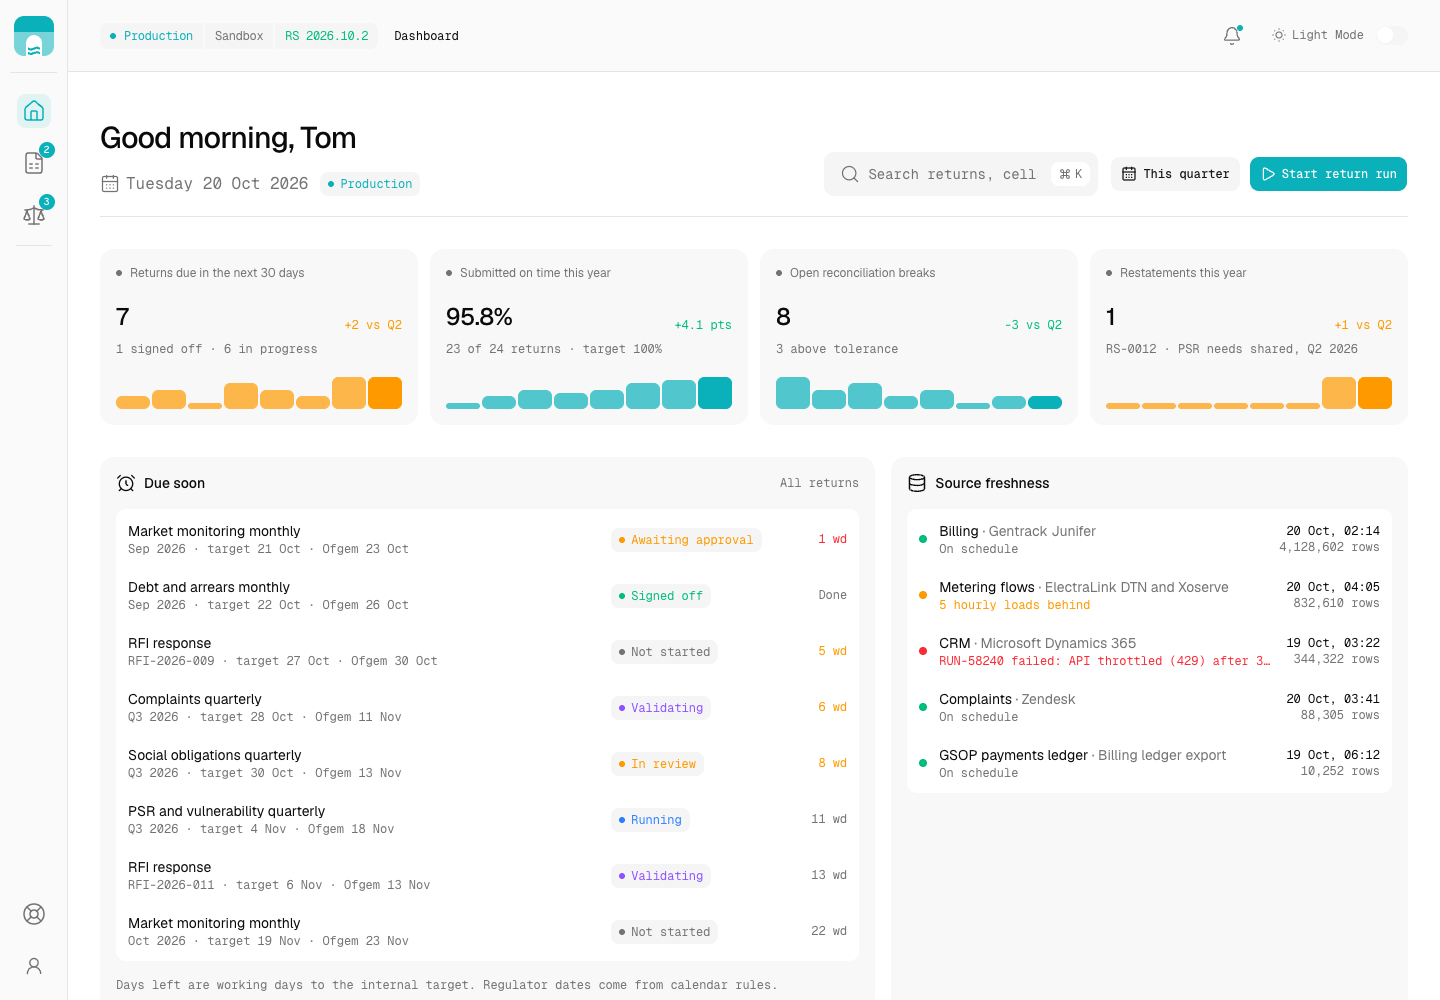
Culvert - Compliance Reporting Pipeline from Source Extract to Signed-Off Ofgem Return
Designed and built a clickable regulatory reporting pipeline for a Great Britain electricity and gas supplier: pinned source extracts, versioned transformation rules, reconciliations between systems, validation of every filled return and maker-checker sign-off, with every figure traceable back to the rows that produced it.
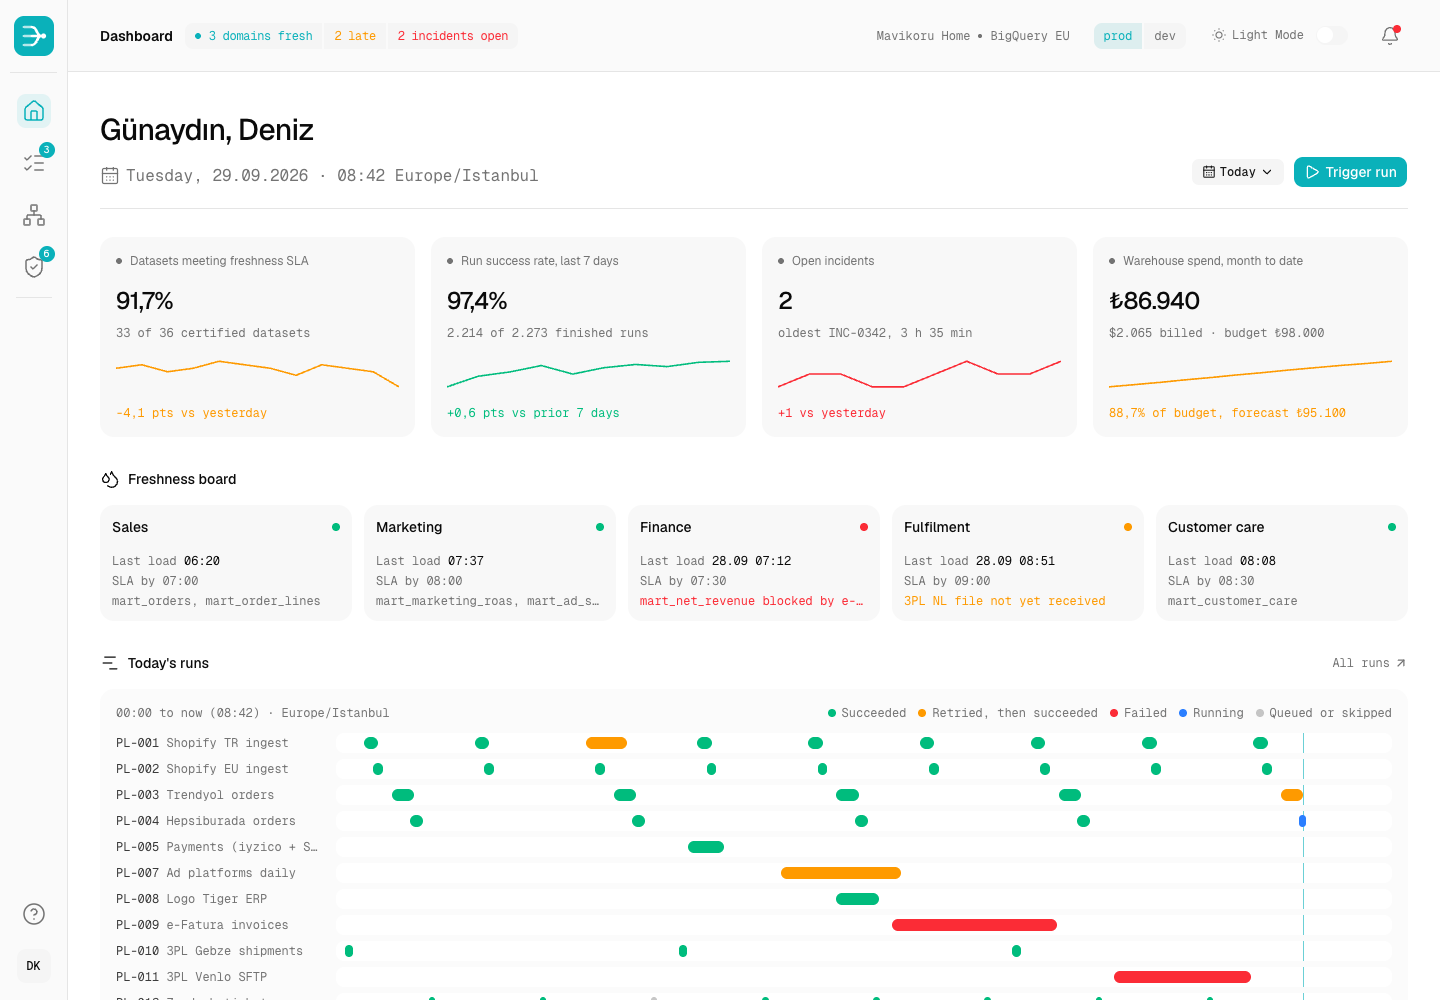
Dokuma - Governed Data Warehouse and Pipeline Operations Console
Designed and built a clickable operations console for a direct-to-consumer home textiles brand's cloud data platform: freshness against SLAs per domain, every pipeline run with retries and a suggested fix, lineage from raw tables to marts, and column-level PII tagging with masking by default under KVKK and GDPR.
Enterprise Software Engineering - Human + AI
Contact Us
© 2026 - Copyright. All Rights reserved Oceanlab
Location
Global Headquarters
21 Merchant Road, 3rd Floor, Singapore 058267
Main corporate office and leadership operations
North America Office
548 Market Street, PMB 12345, San Francisco, CA 94104
Client operations and business development
India Office
402 Shivalik Shilp II, SG Highway, Ahmedabad 380015
Engineering and delivery center

Enterprise Software Engineering - Human + AI
Contact Us
Locations
Global Headquarters
21 Merchant Road, 3rd Floor, Singapore 058267
Main corporate office and leadership operations
North America Office
548 Market Street, PMB 12345, San Francisco, CA 94104
Client operations and business development
India Office
402 Shivalik Shilp II, SG Highway, Ahmedabad 380015
Engineering and delivery center
© 2026 - Copyright. All Rights reserved Oceanlab