Mandacaru - Population Health Dashboard with Risk Cohorts and Care Gaps
Population Health Platform for a Brazilian State Health Secretariat
Designed and built a clickable population health platform, in Portuguese, for a Brazilian state health secretariat and its municipalities: primary care dashboards against performance goals, risk cohorts such as uncontrolled hypertension, identified patient lists for Family Health teams with every access recorded, and dengue surveillance alerts by municipality.
Most of our work is under NDA. Per agreement, we can share the work but not the company details - all names and identifying information shown here have been changed.
Impact
Panorama, risk cohorts, cohort detail, the identified team patient list with its quick view, and surveillance with the alert detail panel. All in Portuguese, with pt-BR dates and epidemiological weeks.
Conjunto APS 2026 v2: prenatal visits, syphilis and HIV tests, dental care in pregnancy, cervical screening, childhood vaccination, and hypertension and diabetes follow-up, each with its numerator, denominator and goal.
Cohort breakdowns by team and alert counts by territory show "<5" or "Dado suprimido" instead of a number, so aggregates cannot point to individuals.
With IBGE codes across 6 health regions, 12 ESF teams with INE and CNES codes, 10 risk cohorts, 12 surveillance alerts with 52-week case curves and 26 identified patients per team list.
The Problem
SESAN's primary care department assembled its indicators by hand: analysts downloaded SISAB, TabNet and SINAN extracts every quarter and emailed PDFs to 118 municipal coordinators, by then three to five months old. ESF teams could not see which hypertensive patients had gone six months without a blood pressure reading, dengue rises were spotted a week late, poor data looked like poor care, and identified patient lists circulated by email with no record of who opened them.
Our Solution
Mandacaru turns primary care, mortality, birth, notifiable disease and hospital admission data into dashboards for the state, health regions, municipalities and teams. It sorts registered people into risk cohorts, gives each ESF team an identified list for its own territory only, logs every view of identified data, and raises dengue alerts against each municipality's historical pattern.
The Challenge: Population Health Across 118 Municipalities
In the SUS, municipalities deliver primary care through Family Health teams and the state coordinates. A state platform has to serve both levels from national systems that were never designed to work together, without letting identified health data leave the team responsible for each person.
Data Spread Across National Systems
Primary care records come from e-SUS APS and SISAB, deaths from SIM, births from SINASC, notifiable diseases from SINAN, admissions from SIH/SUS and vaccines from SI-PNI, with teams and establishments in CNES. Each has its own identifiers, reporting lag and schedule.
Identified Data Only Where It Belongs
The LGPD treats health data as sensitive personal data. The state and health regions may see aggregates only, while a municipality and the responsible team need named lists to plan follow-up. Every access to those lists has to be justified and recorded.
Indicator Rules That Keep Changing
Federal primary care financing moved from Previne Brasil to a new methodology from 2024, with a quality component built on indicators. Definitions, goals and sources change, so they cannot be hard-coded into the product.
Publishing Without Exposing People
The Access to Information Law and SUS social participation mean results are presented to municipal health councils and the public. In small municipalities a low count can identify a person, so published figures need suppression rules applied before anything leaves the system.
Our Approach: From SUS Rules to a Clickable Platform
Spec and Rules Research
Mapped 10 user roles, from state analysts and epidemiologists to ESF nurses, community health agents and the data protection officer, 41 screens across the staff app, a mobile ACS app and public pages, and the data model for territories, people, cohorts, care gaps, indicators, alerts and access logs. Wrote down the rules the design follows: SUS organisation, the national information systems, versioned performance indicators, CNS and CPF identifiers, the LGPD, the Access to Information Law and endemic channel surveillance.
Clickable Demo on a Production UI Kit
Built 5 key screens on a production dashboard kit, signed in as a municipal coordinator: the Panorama with KPIs, performance bars against goals and approval of access requests, the cohort list, cohort detail with risk tiers by team and outcomes over time, the identified team patient list with bulk Assign to ACS and Mark gap resolved, and surveillance with a hex tile map, endemic channel chart and Confirm or Dismiss on each alert. All actions run on local state.
What a Production Build Adds
Data from the state warehouse fed by e-SUS APS, SIM, SINASC, SINAN, SIH/SUS, SI-PNI, CNES and IBGE, and from the RNDS over FHIR where the state has access. gov.br or state sign-in with territory-based access scopes, an append-only access log, OpenStreetMap tiles, SMS and email alerts, and the remaining screens: indicator pages, cohort builder, data quality, programmes, council reports, settings, the offline ACS app and the public pages. The LGPD legal basis and impact assessment are confirmed with SESAN's DPO.
Why It Works: Aggregates for the State, Names for the Team
Access Is Visible and Recorded
Any page with identified people shows a yellow "Dados identificados · acesso registrado" banner with the user, scope, reason and time. A coordinator gives a reason before opening a team's list, CNS numbers show only the last four digits, and export asks for a reason and carries a watermark.
Poor Data Is Not Mistaken for Poor Care
Teams to watch are listed with the indicator dragging them down and their data quality grade from A to D, and the Panorama shows the last load from each source, so a team with incomplete e-SUS records is not read as a team giving poor care.
Cohorts Explain Themselves
Each cohort shows its rule in plain language, its version, refresh schedule and the care gaps it generates. Every patient on the team list carries the reason they qualified, such as their last blood pressure reading, and the gaps go to the responsible community health agent.
Alerts Support the Epidemiologist
Dengue alerts compare the current week with a 5-year endemic channel and incidence per 100,000, and recent weeks are shaded as still arriving to allow for notification delay. Confirming or dismissing an alert is the epidemiologist's decision, and a dismissal needs a reason.
Related case studies
View all: Health data & interoperability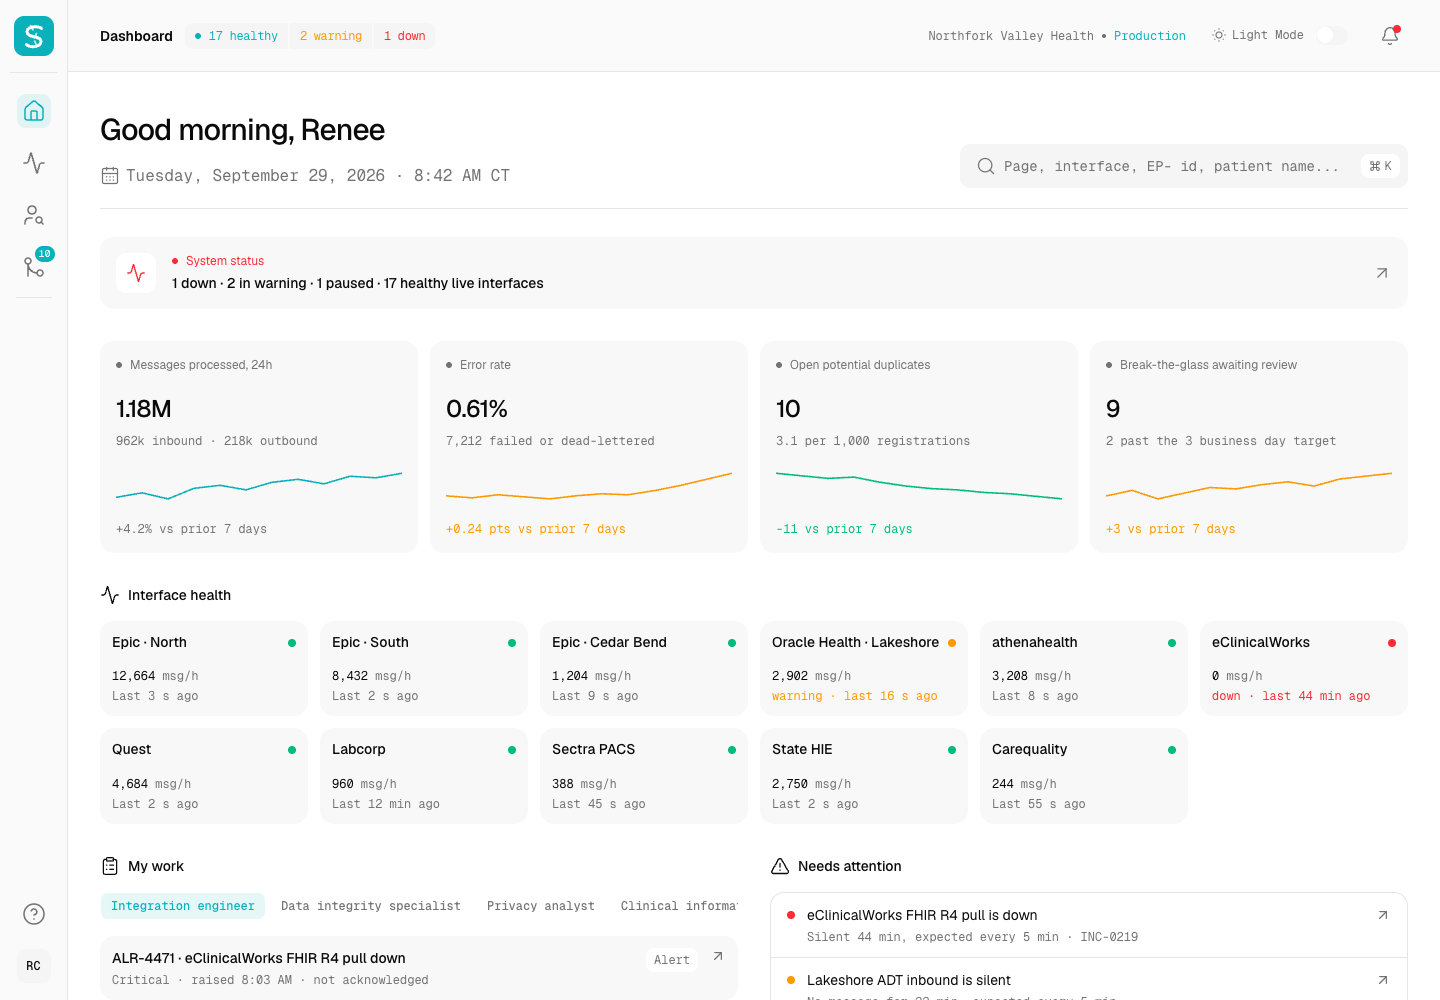
Sutura - HIPAA-Compliant Patient Data Hub over HL7 and FHIR
Designed and built a clickable patient data hub for a US health system running Epic, Oracle Health, athenahealth and eClinicalWorks: a live monitor for every HL7 v2, FHIR and HIE feed, one matched enterprise patient with a provenance-tagged record, and a duplicates queue where a person decides every uncertain match.
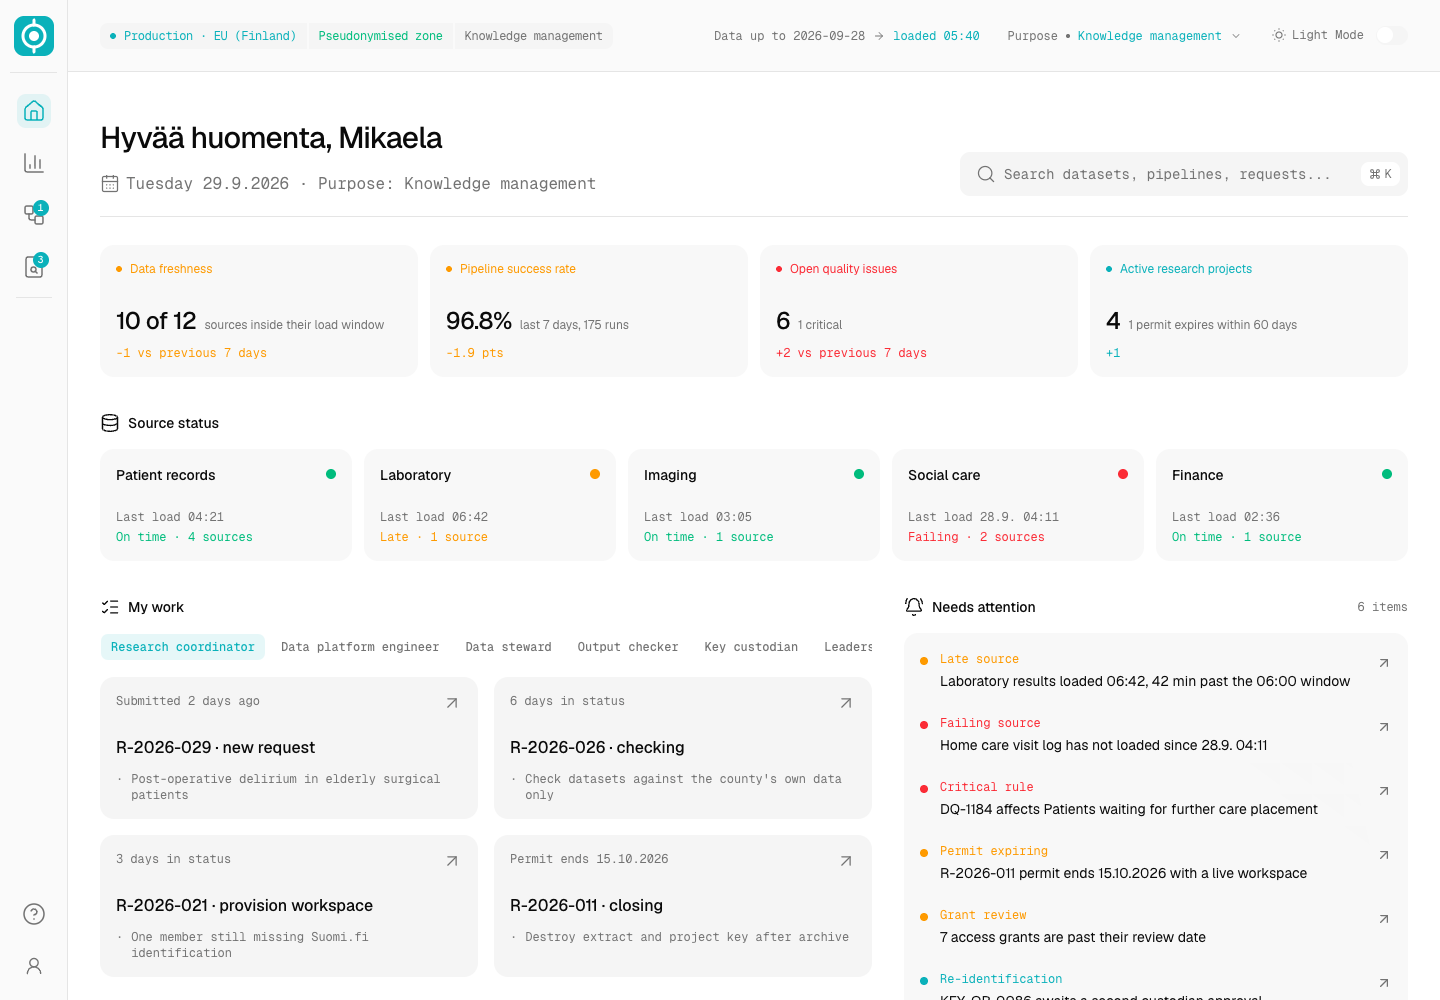
Kaivo - Pseudonymised Health Data Warehouse for Leadership Analytics and Permitted Research
Designed and built a clickable data platform console for a bilingual Finnish wellbeing services county: nightly pipelines that pseudonymise patient, lab, imaging, social care and finance data, leadership dashboards built only from aggregates, and a research request desk that ties every project to its data permit.
Enterprise Software Engineering - Human + AI
Contact Us
© 2026 - Copyright. All Rights reserved Oceanlab
Location
Global Headquarters
21 Merchant Road, 3rd Floor, Singapore 058267
Main corporate office and leadership operations
North America Office
548 Market Street, PMB 12345, San Francisco, CA 94104
Client operations and business development
India Office
402 Shivalik Shilp II, SG Highway, Ahmedabad 380015
Engineering and delivery center

Enterprise Software Engineering - Human + AI
Contact Us
Locations
Global Headquarters
21 Merchant Road, 3rd Floor, Singapore 058267
Main corporate office and leadership operations
North America Office
548 Market Street, PMB 12345, San Francisco, CA 94104
Client operations and business development
India Office
402 Shivalik Shilp II, SG Highway, Ahmedabad 380015
Engineering and delivery center
© 2026 - Copyright. All Rights reserved Oceanlab