Shikra - Grid Asset Monitoring Platform That Monitors and Never Controls
Grid Asset Monitoring for a Pakistani Power Distributor
Designed and built a clickable grid asset monitoring platform for a regional electricity distribution company in Sindh: a control room dashboard, an alarm list built for shift work, an asset register with nameplate data, and an explainable health and risk score for every transformer and breaker - all read-only from SCADA.
Most of our work is under NDA. Per agreement, we can share the work but not the company details - all names and identifying information shown here have been changed.
Impact
Control room dashboard, alarms, asset register, asset detail with 7 tabs, and health and risk. Each of the 30 demo assets opens its own detail page.
DGA 30%, loading history 20%, inspection condition 15%, oil quality 15%, age 10% and failure history 10% give each transformer a 0 to 100 index and an H1 to H5 band, with every factor's input and contribution shown.
Shikra reads a replica historian in a DMZ fed one way from the OT network. No screen sends a command to SCADA, an RTU or a breaker, or issues a switching step.
30 assets across 7 classes on 12 feeders and 7 substations in 5 divisions, with 22 alarms, 5 open outages, 10 work orders and a DGA history for every transformer.
The Problem
RPDC's control room saw breaker trips and feeder loads on SCADA, but everything below the 11 kV feeder breaker was close to invisible. Transformer burnouts were found when customers called, nameplate data lived in spreadsheets per division, oil sample results arrived as PDFs nobody compared, inspection sheets were paper, and reliability figures for the regulator were compiled by hand from outage registers.
Our Solution
Shikra puts about 9,000 distribution transformers and 400 substations on one register with live telemetry, sensor data and alarms, scores every asset's health and risk with the reasons behind it, and turns alarms and predictions into work for field crews. It reads SCADA data from a one-way DMZ replica and has no path to control the network.
The Challenge: Seeing Below the Feeder Breaker
A distribution company in Pakistan runs thousands of small transformers across city and rural networks, reports reliability to NEPRA, and has to keep its operational network sealed off from IT systems. Shikra had to give engineers a full picture of the network without ever touching it.
Blind Below 11 kV
SCADA covered grid stations and feeder breakers, not the distribution transformers behind them. Summer peaks overloaded the same transformers year after year, and a failure was usually first reported by a customer.
Monitoring Without a Path to Control
The OT network is segregated from the corporate network. Shikra may only read a replica historian in a DMZ, fed through a data diode or a one-directional firewall rule, following IEC 62443 and IEC 62351. Switching stays under RPDC's safety rules, instructed and confirmed by voice in the control room's own system.
Condition Data in Five Places
Nameplates sat in division spreadsheets, the GIS ran months behind the field, lab oil results came back as PDFs and inspections were on paper. Dissolved gas results need interpreting with IEEE C57.104 and IEC 60599, including the Duval triangle, before they say anything about a transformer.
Budgets and Reliability by Hand
The capital budget was spread by division instead of by risk, and nobody could say which 200 transformers most needed replacing next year, or why. SAIFI and SAIDI for NEPRA were compiled manually from outage registers, with definitions that must follow IEEE 1366 and the regulator's own exclusions.
Our Approach: From Grid Rules to a Clickable Control Room
Spec and Rules Research
Mapped 10 user roles from control room operator to OT security officer, 41 screens (33 console and 8 offline-first field app screens) and the data model for substations, feeders, assets and nameplates, sensors, telemetry, versioned alarm rules, alarms, DGA samples, health scores, outages, work orders, inspections and capital scenarios. Wrote down the rules the design follows: NEPRA reliability reporting with SAIFI and SAIDI per IEEE 1366, one-way OT data flow per IEC 62443 and IEC 62351, DGA per IEEE C57.104 and IEC 60599, loading per IEC 60076-7, and data minimisation alongside PECA 2016.
Clickable Demo on a Production UI Kit
Built 5 key screens on a production dashboard kit: the control room dashboard with 5 KPI cards, alarm stream, needs-attention list, system load against yesterday and forecast, crews, open outages, hot spots, control room mode and shift handover; the alarm list with flood grouping, acknowledge, shelve and escalate; the asset register; asset detail with live values, health, DGA, loading history and an override sheet; and health and risk with a clickable 5x5 matrix and score explanation panel. All actions run on local state.
What a Production Build Adds
Read-only connections to the SCADA historian replica (such as AVEVA PI), a data diode, ADMS switching programme exports, Esri ArcGIS Utility Network, LoRaWAN and NB-IoT transformer sensors through an MQTT broker in the DMZ, online DGA monitors, lab result imports, thermal images, SAP S/4HANA or Maximo, billing exports and weather. Microsoft Entra ID sign-in with MFA, SMS escalation, a full audit log, and the remaining screens: network map, feeders, predicted failures, hotspots, outages and reliability indices, work orders, capital planning, reports, admin and the field app.
Why It Works: Clear Answers for the Control Room
Monitors, Never Controls
There is no control button anywhere in Shikra, and every page says so. A data freshness pill shows how old the SCADA data is, and the design marks live values as stale when the historian feed falls behind, so nobody acts on a number that only looks current.
Every Score Explains Itself
The health index is built from weighted factors, and the explanation panel lists each factor's input, score and contribution with the model version. An engineer can override a band only with a reason and an expiry date, and the override stays flagged in every list.
Alarms Built for a Shift
Unacknowledged P1 alarms pulse, repeat alarms from one asset within 10 minutes are grouped, a P1 needs a note to acknowledge, bulk acknowledge skips P1s, and escalation shows the SMS to the on-call engineer before it goes. Clearing an alarm never acknowledges it.
Risk Weighs Who Is on Supply
The 5x5 risk matrix sets probability of failure from the health band against consequence from customers served, critical loads, public safety and replacement cost. A transformer feeding a maternity clinic ranks above one in the same condition serving fewer customers, and each row gives its top reason in plain words.
Related case studies
View all: Energy & utilities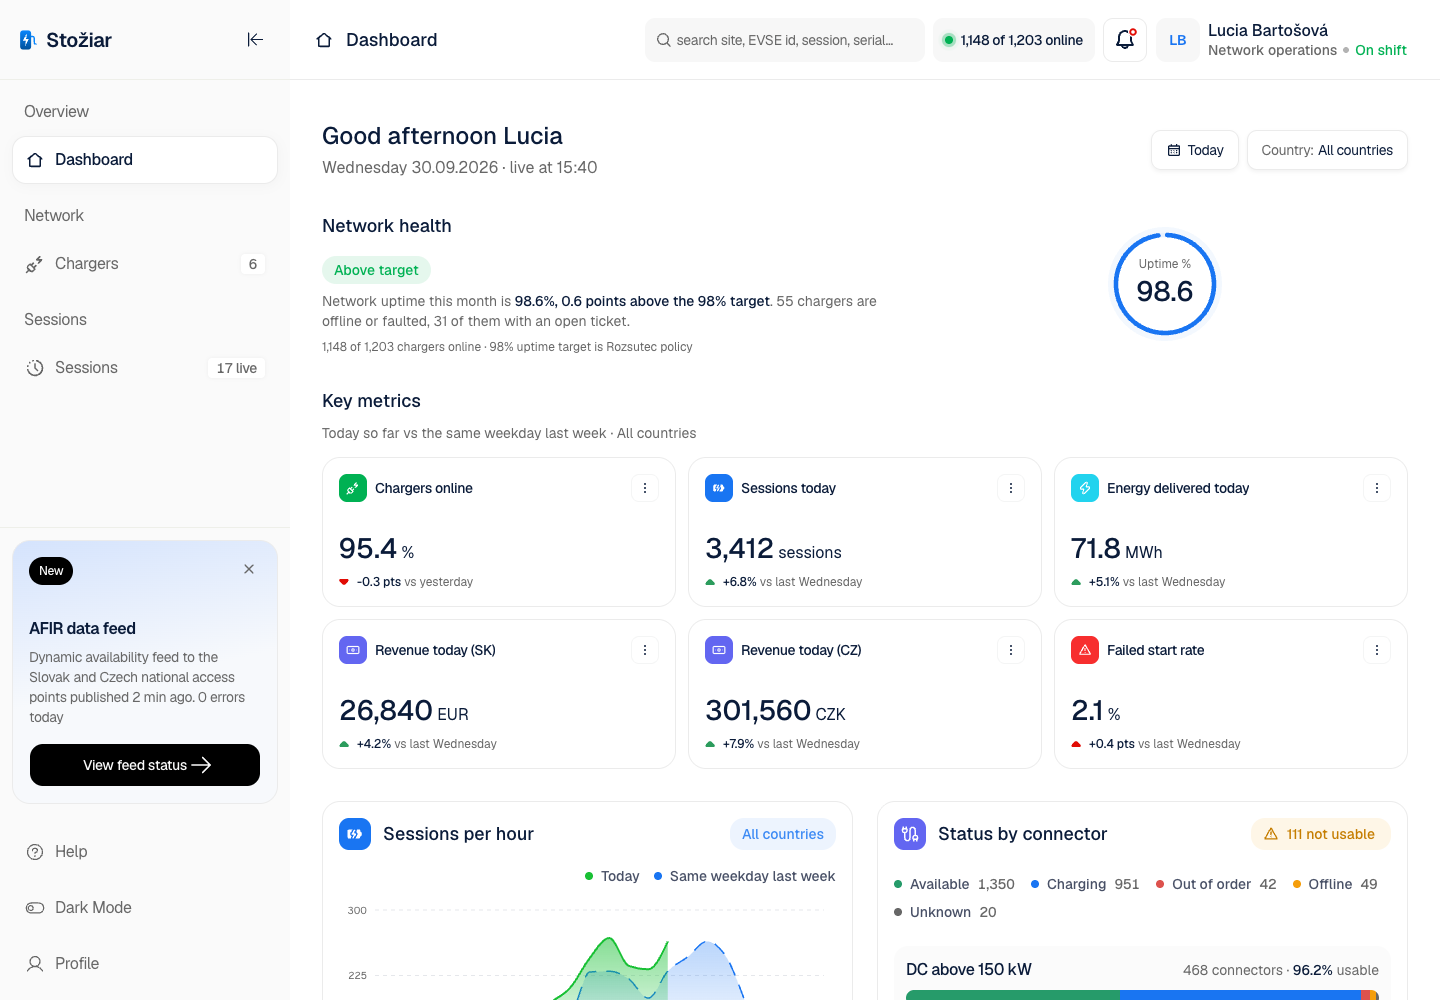
Stožiar - EV Charging App and Operator Console for a Two-Country Charge Point Network
Designed and built a clickable operator console for a Bratislava charge point operator running about 1,200 public chargers in Slovakia and Czechia: live network health, every charger and its OCPP state, audited remote commands, and session detail with signed meter values, the full price calculation and refunds within each user's limit.

Helio - Smart Solar & Storage App with IoT Sensor Network from Prototype to Production
Built a consumer iOS and Android app for solar generation, battery storage, EV charging and smart-home device control - backed by an IoT sensor network and AI optimisation engine. Shipped from clickable AI prototype to App Store in 16 weeks.
Enterprise Software Engineering - Human + AI
Contact Us
© 2026 - Copyright. All Rights reserved Oceanlab
Location
Global Headquarters
21 Merchant Road, 3rd Floor, Singapore 058267
Main corporate office and leadership operations
North America Office
548 Market Street, PMB 12345, San Francisco, CA 94104
Client operations and business development
India Office
402 Shivalik Shilp II, SG Highway, Ahmedabad 380015
Engineering and delivery center

Enterprise Software Engineering - Human + AI
Contact Us
Locations
Global Headquarters
21 Merchant Road, 3rd Floor, Singapore 058267
Main corporate office and leadership operations
North America Office
548 Market Street, PMB 12345, San Francisco, CA 94104
Client operations and business development
India Office
402 Shivalik Shilp II, SG Highway, Ahmedabad 380015
Engineering and delivery center
© 2026 - Copyright. All Rights reserved Oceanlab